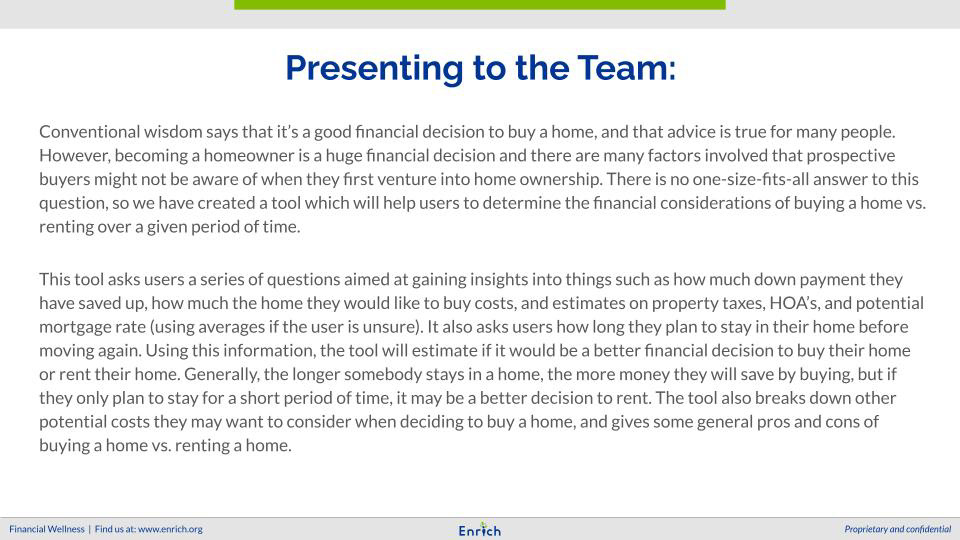
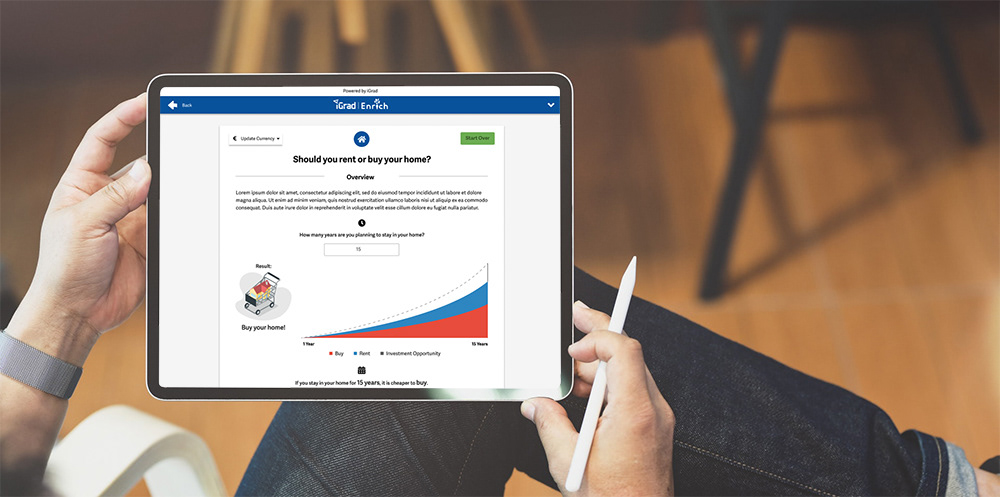
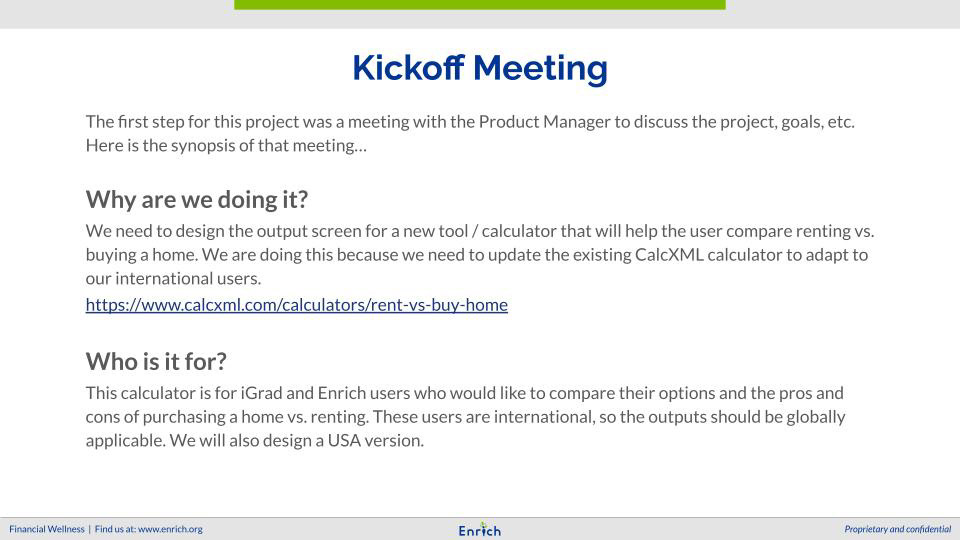
The goal of this project was to create an output screen for a calculator helping people decide if it would be better to rent or buy their home if they live there for a specific number of years. During this project, I conducted some UX research and went through a robust ideation process before moving on to the high fidelity designs. I worked closely with the rest of the product team during the process to make sure the designs were of a high standard that matches with the rest of the iGrad/Enrich design system before handing the designs off to the developers.
Skills
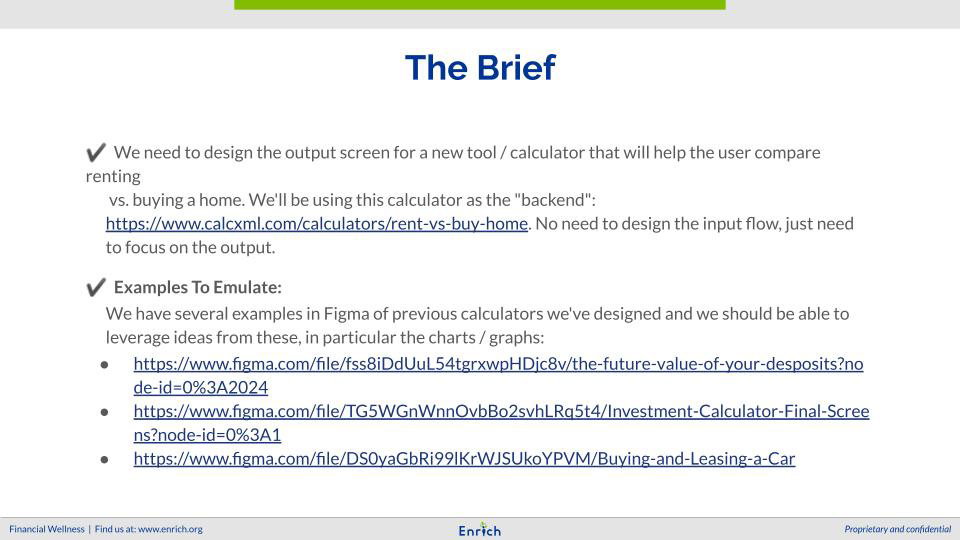
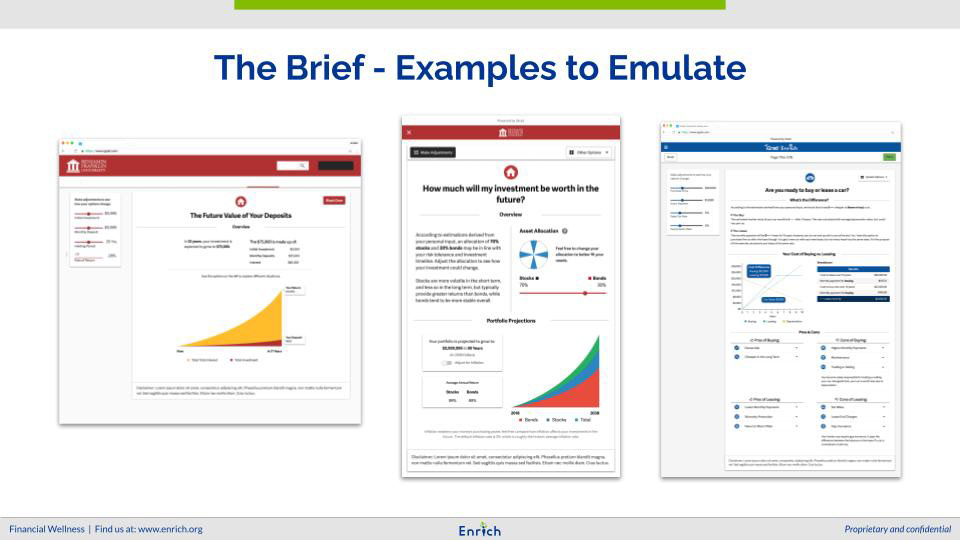
Competitive Analysis, User Stories, User Personas, Brainstorming, Low Fidelity Wireframing, High Fidelity Designs
Tools
Google Slides, Balsamiq, Figma, Adobe Illustrator
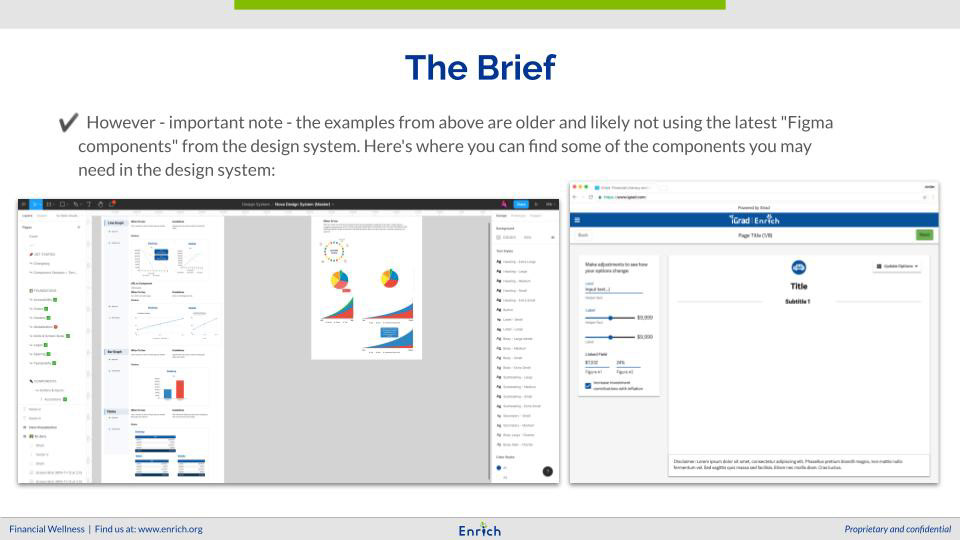
COMPETITIVE ANALYSIS
Scroll through the following PDF to see the full competitive analysis.
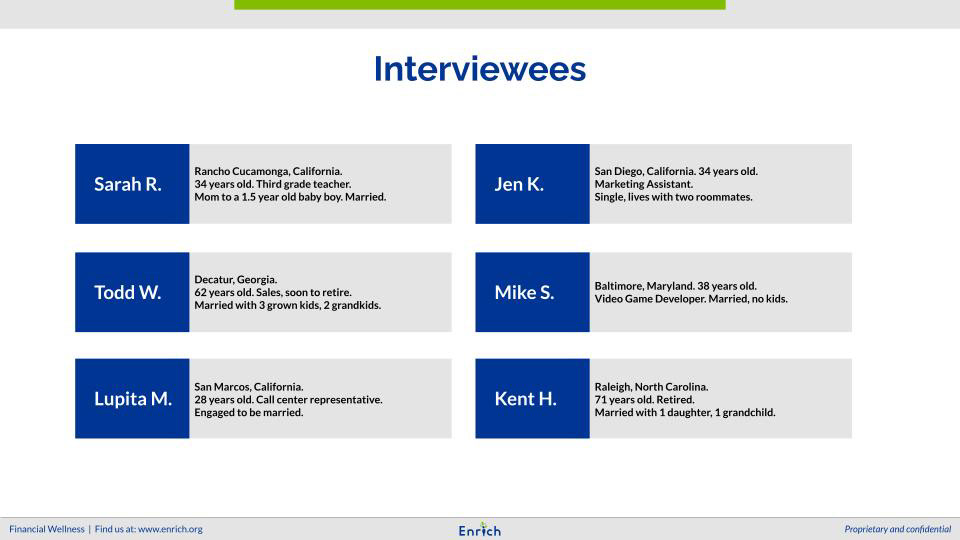
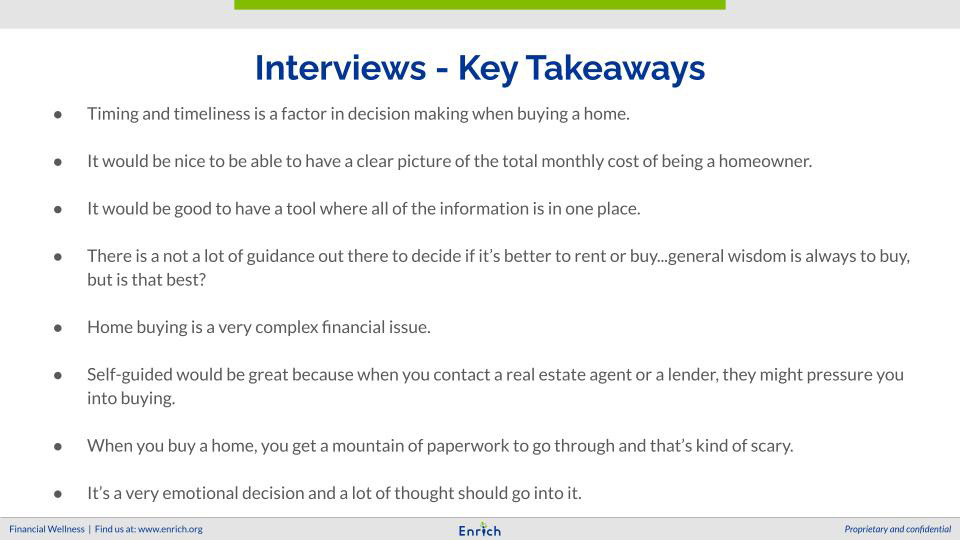
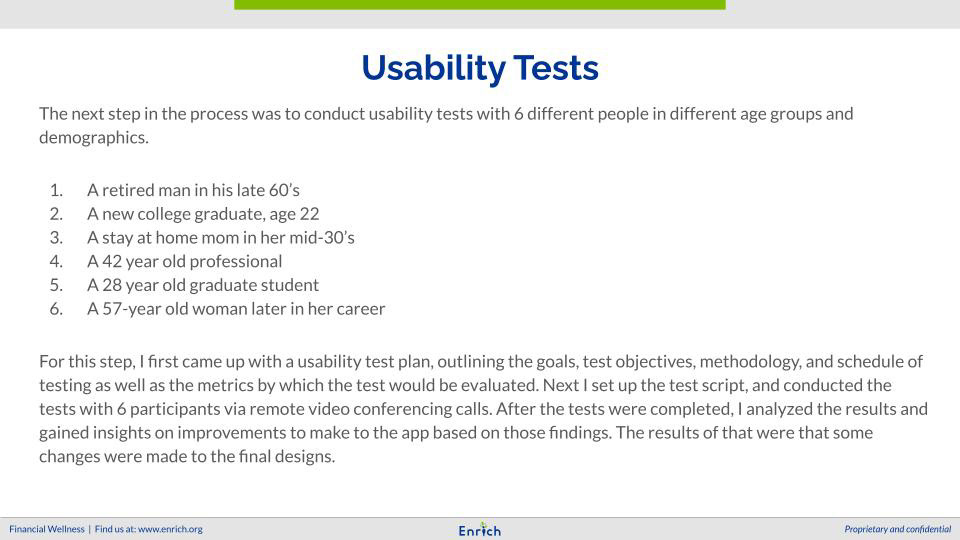
USER Interviews
USER PERSONAS AND USER STORIES
Scroll through the following PDF to see all.
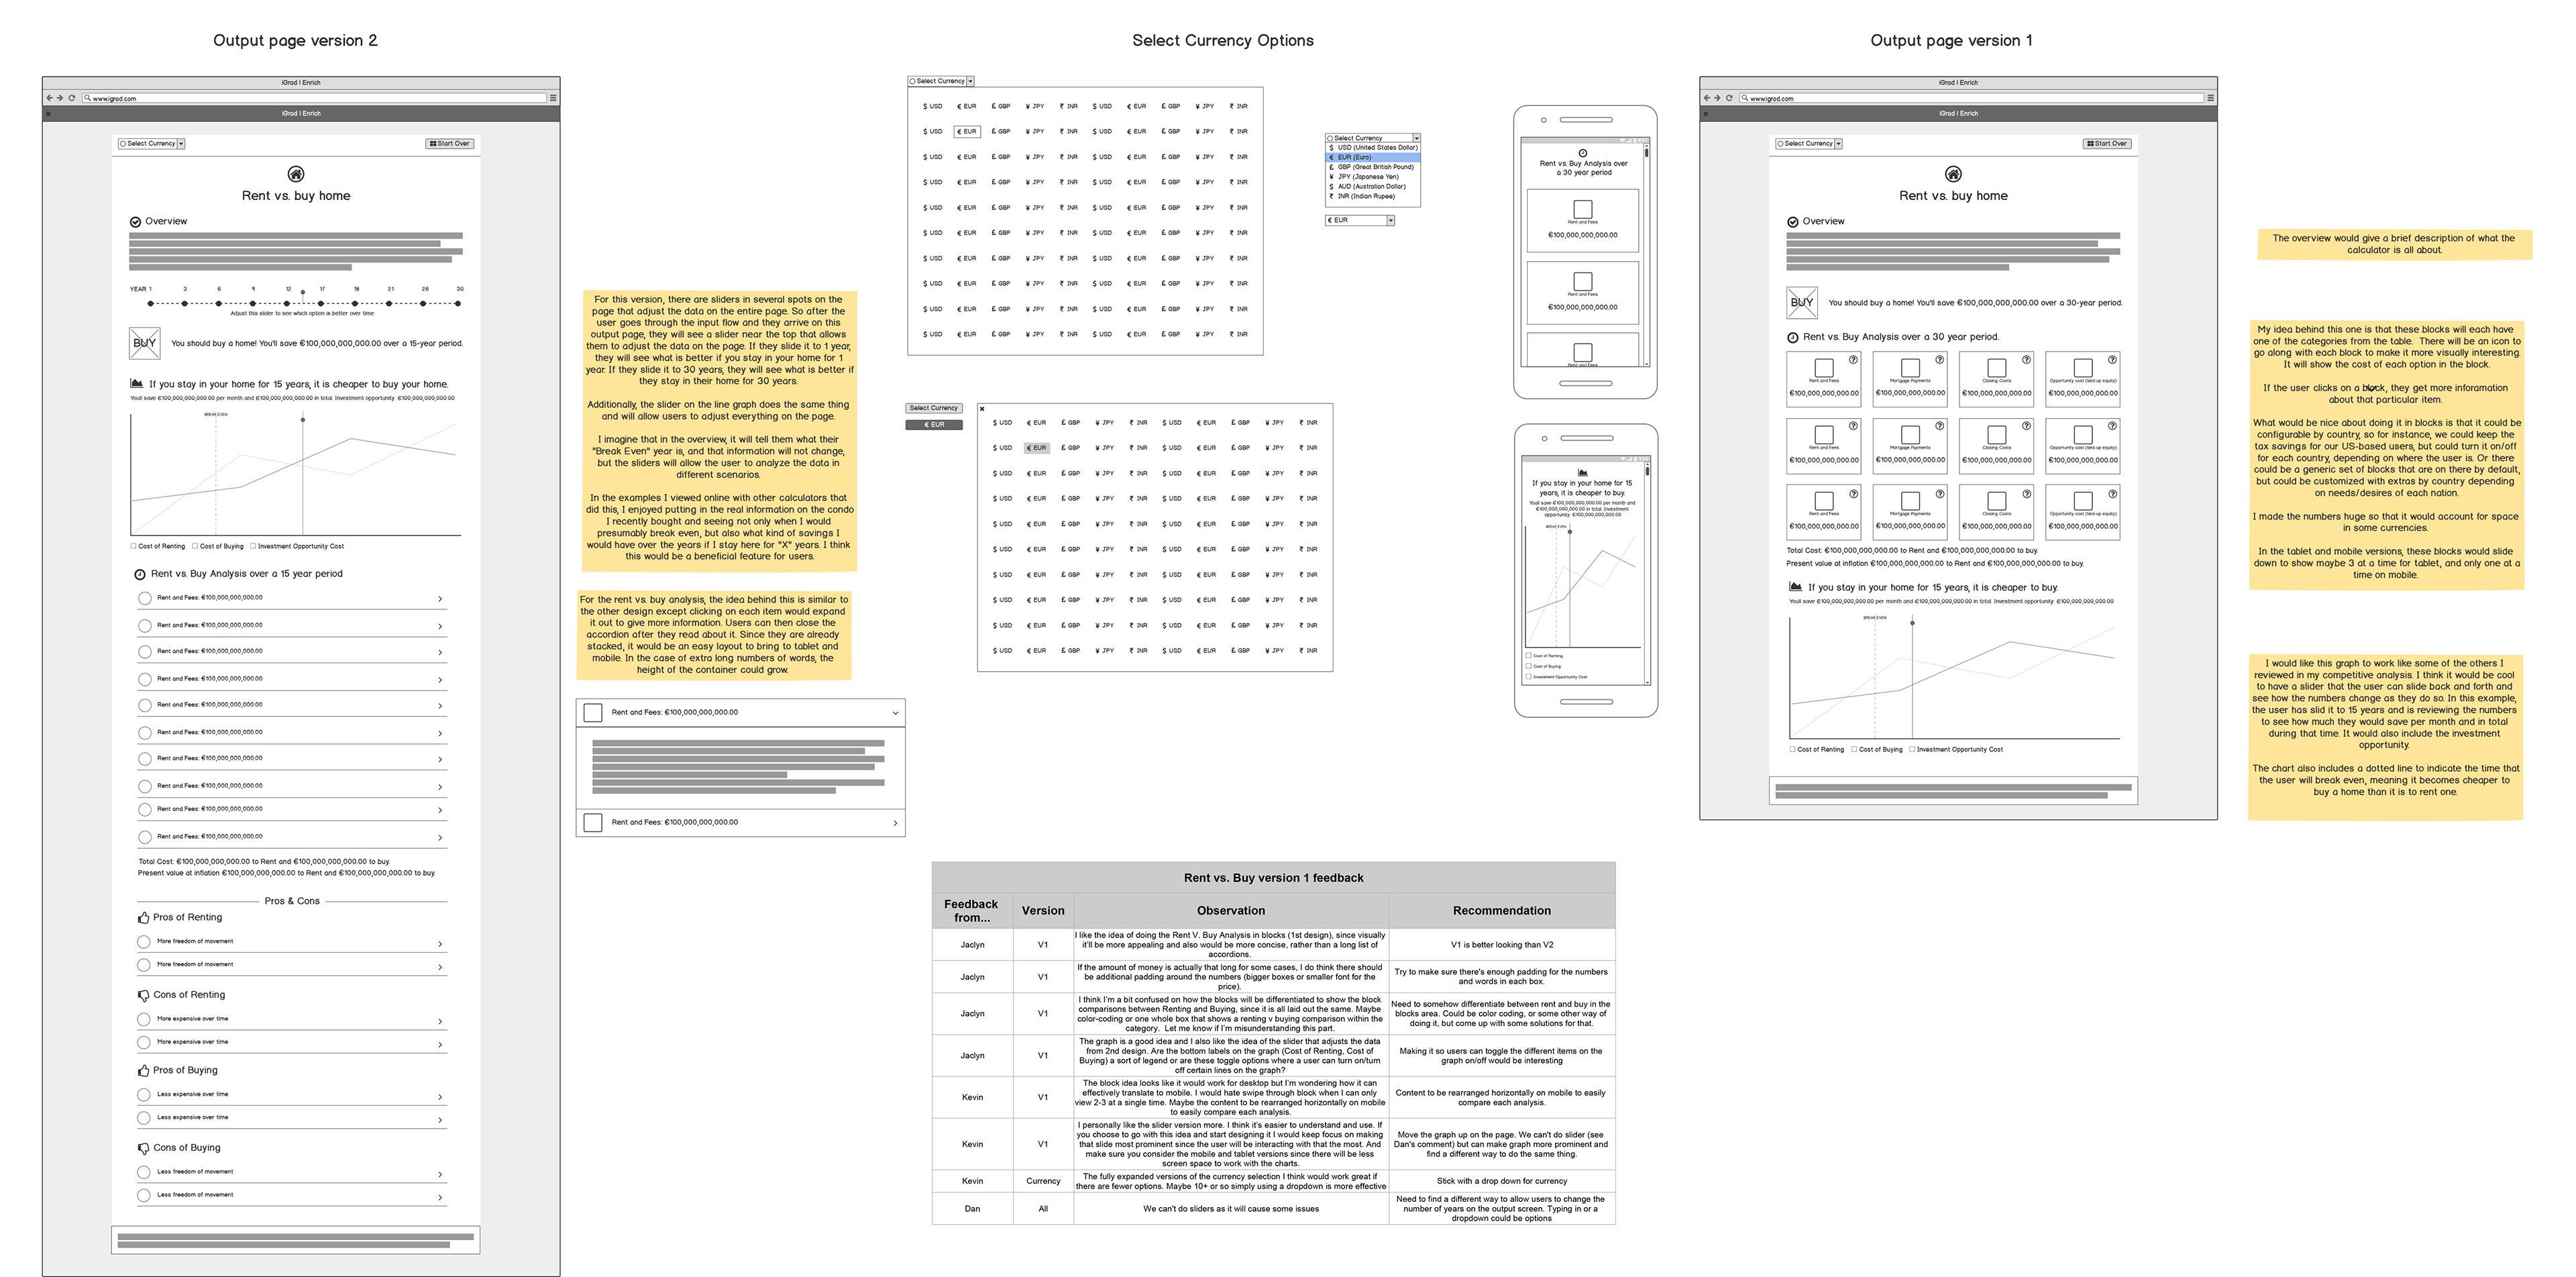
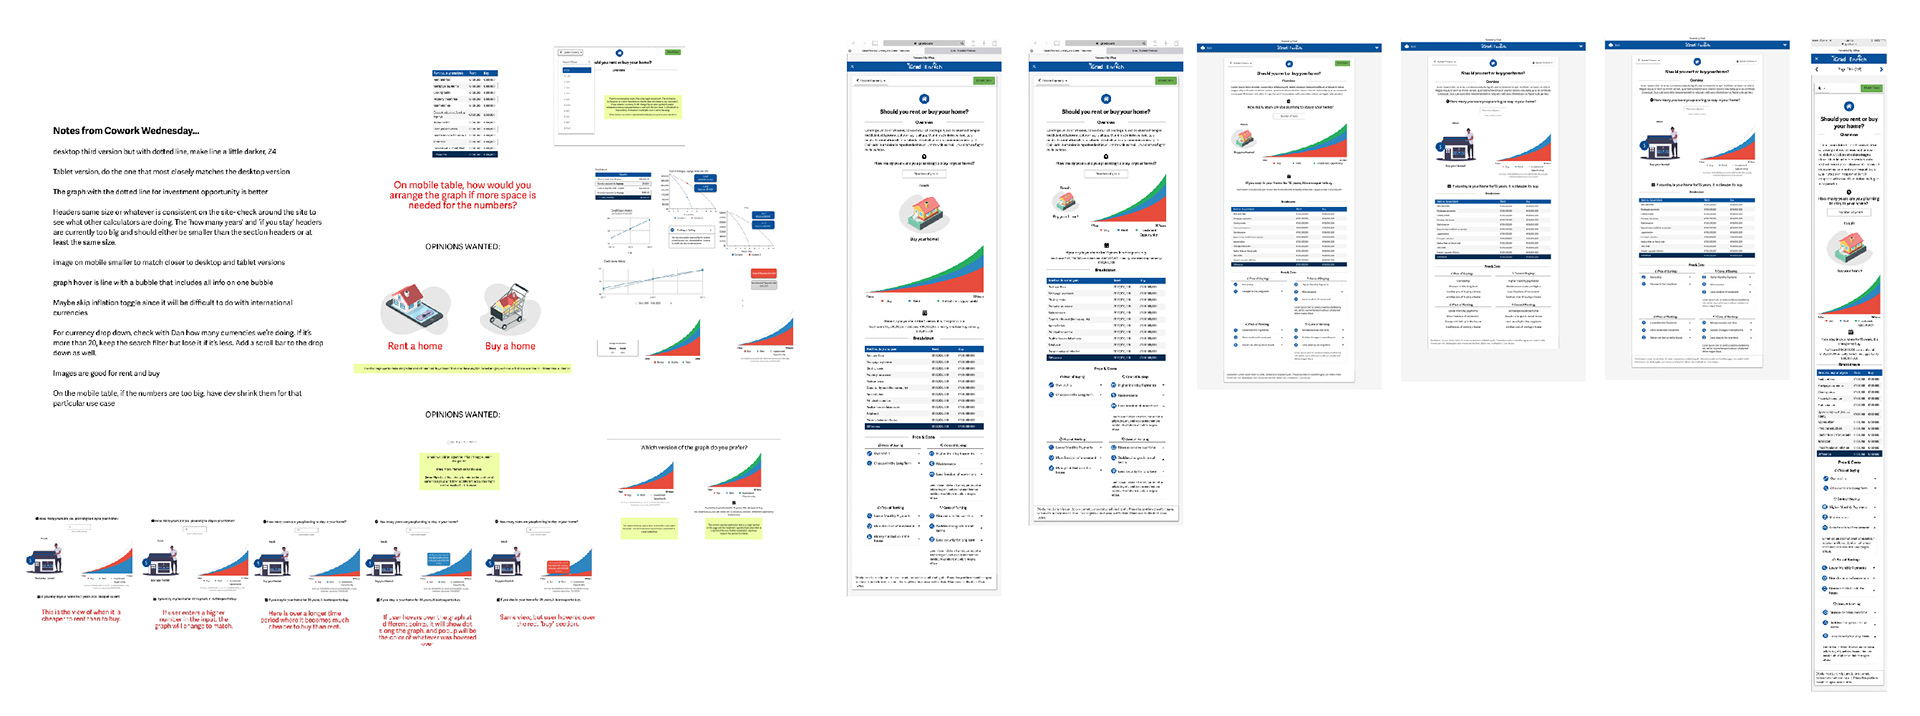
ideation AND wireframing
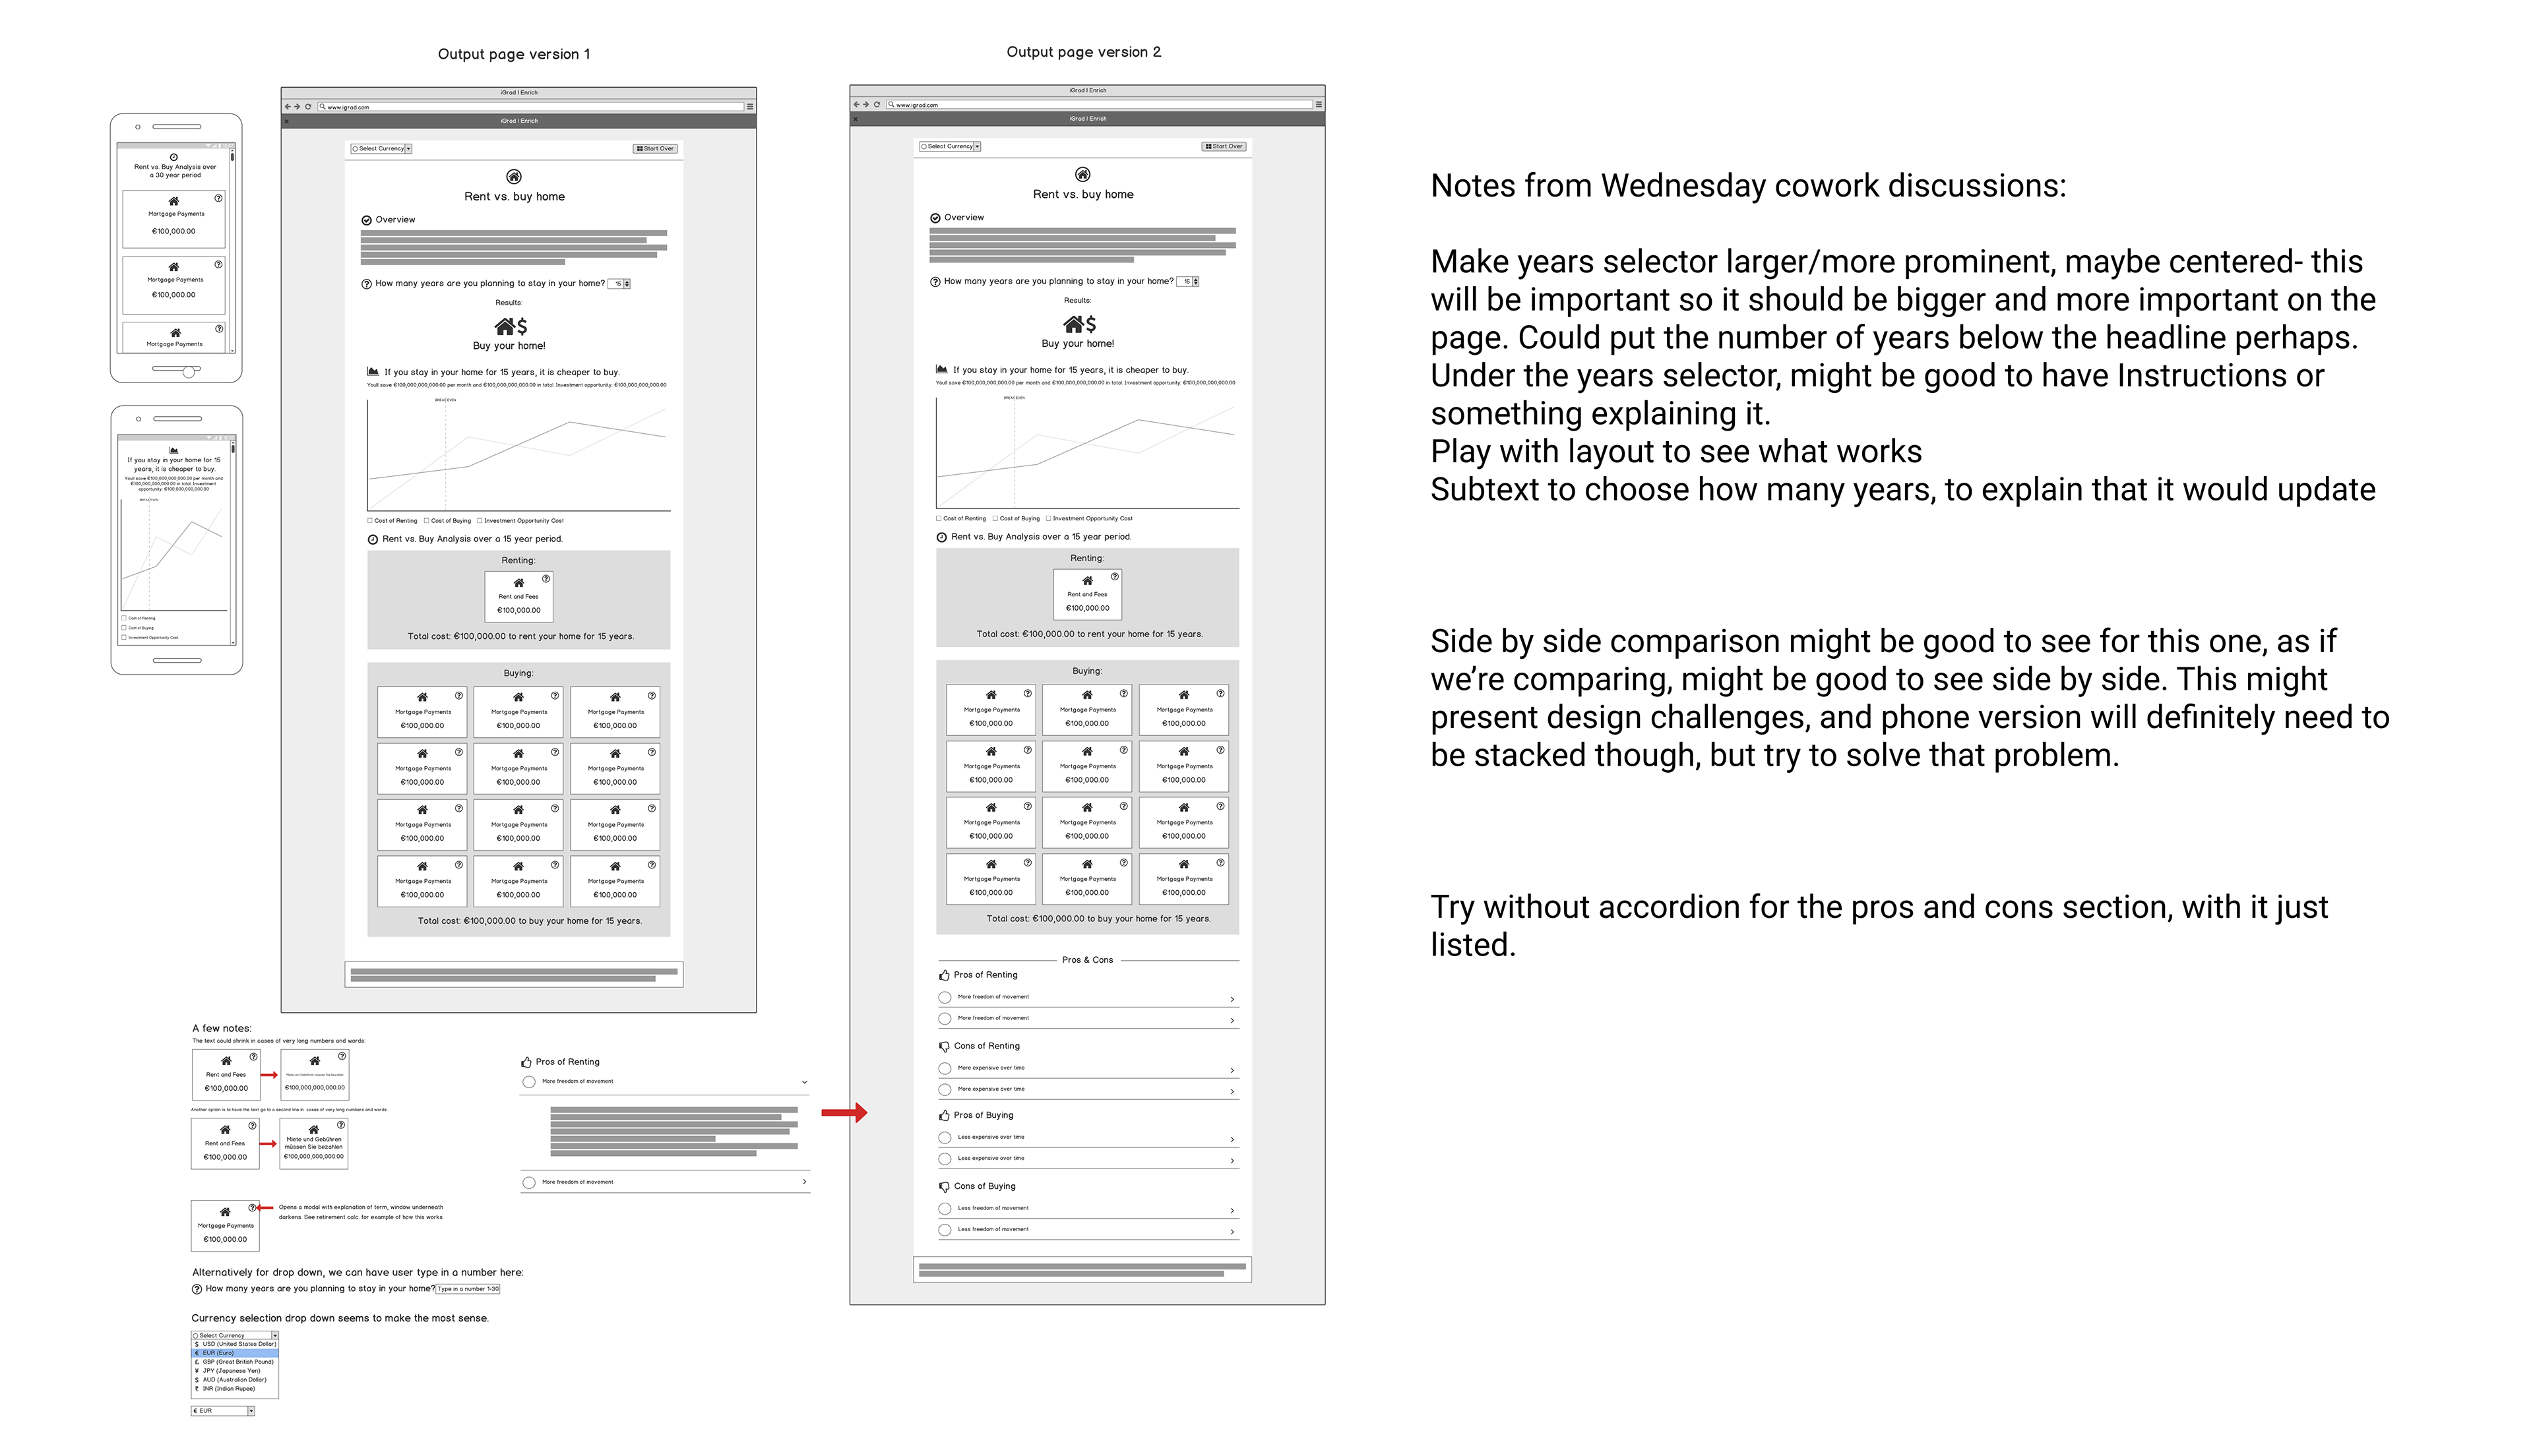
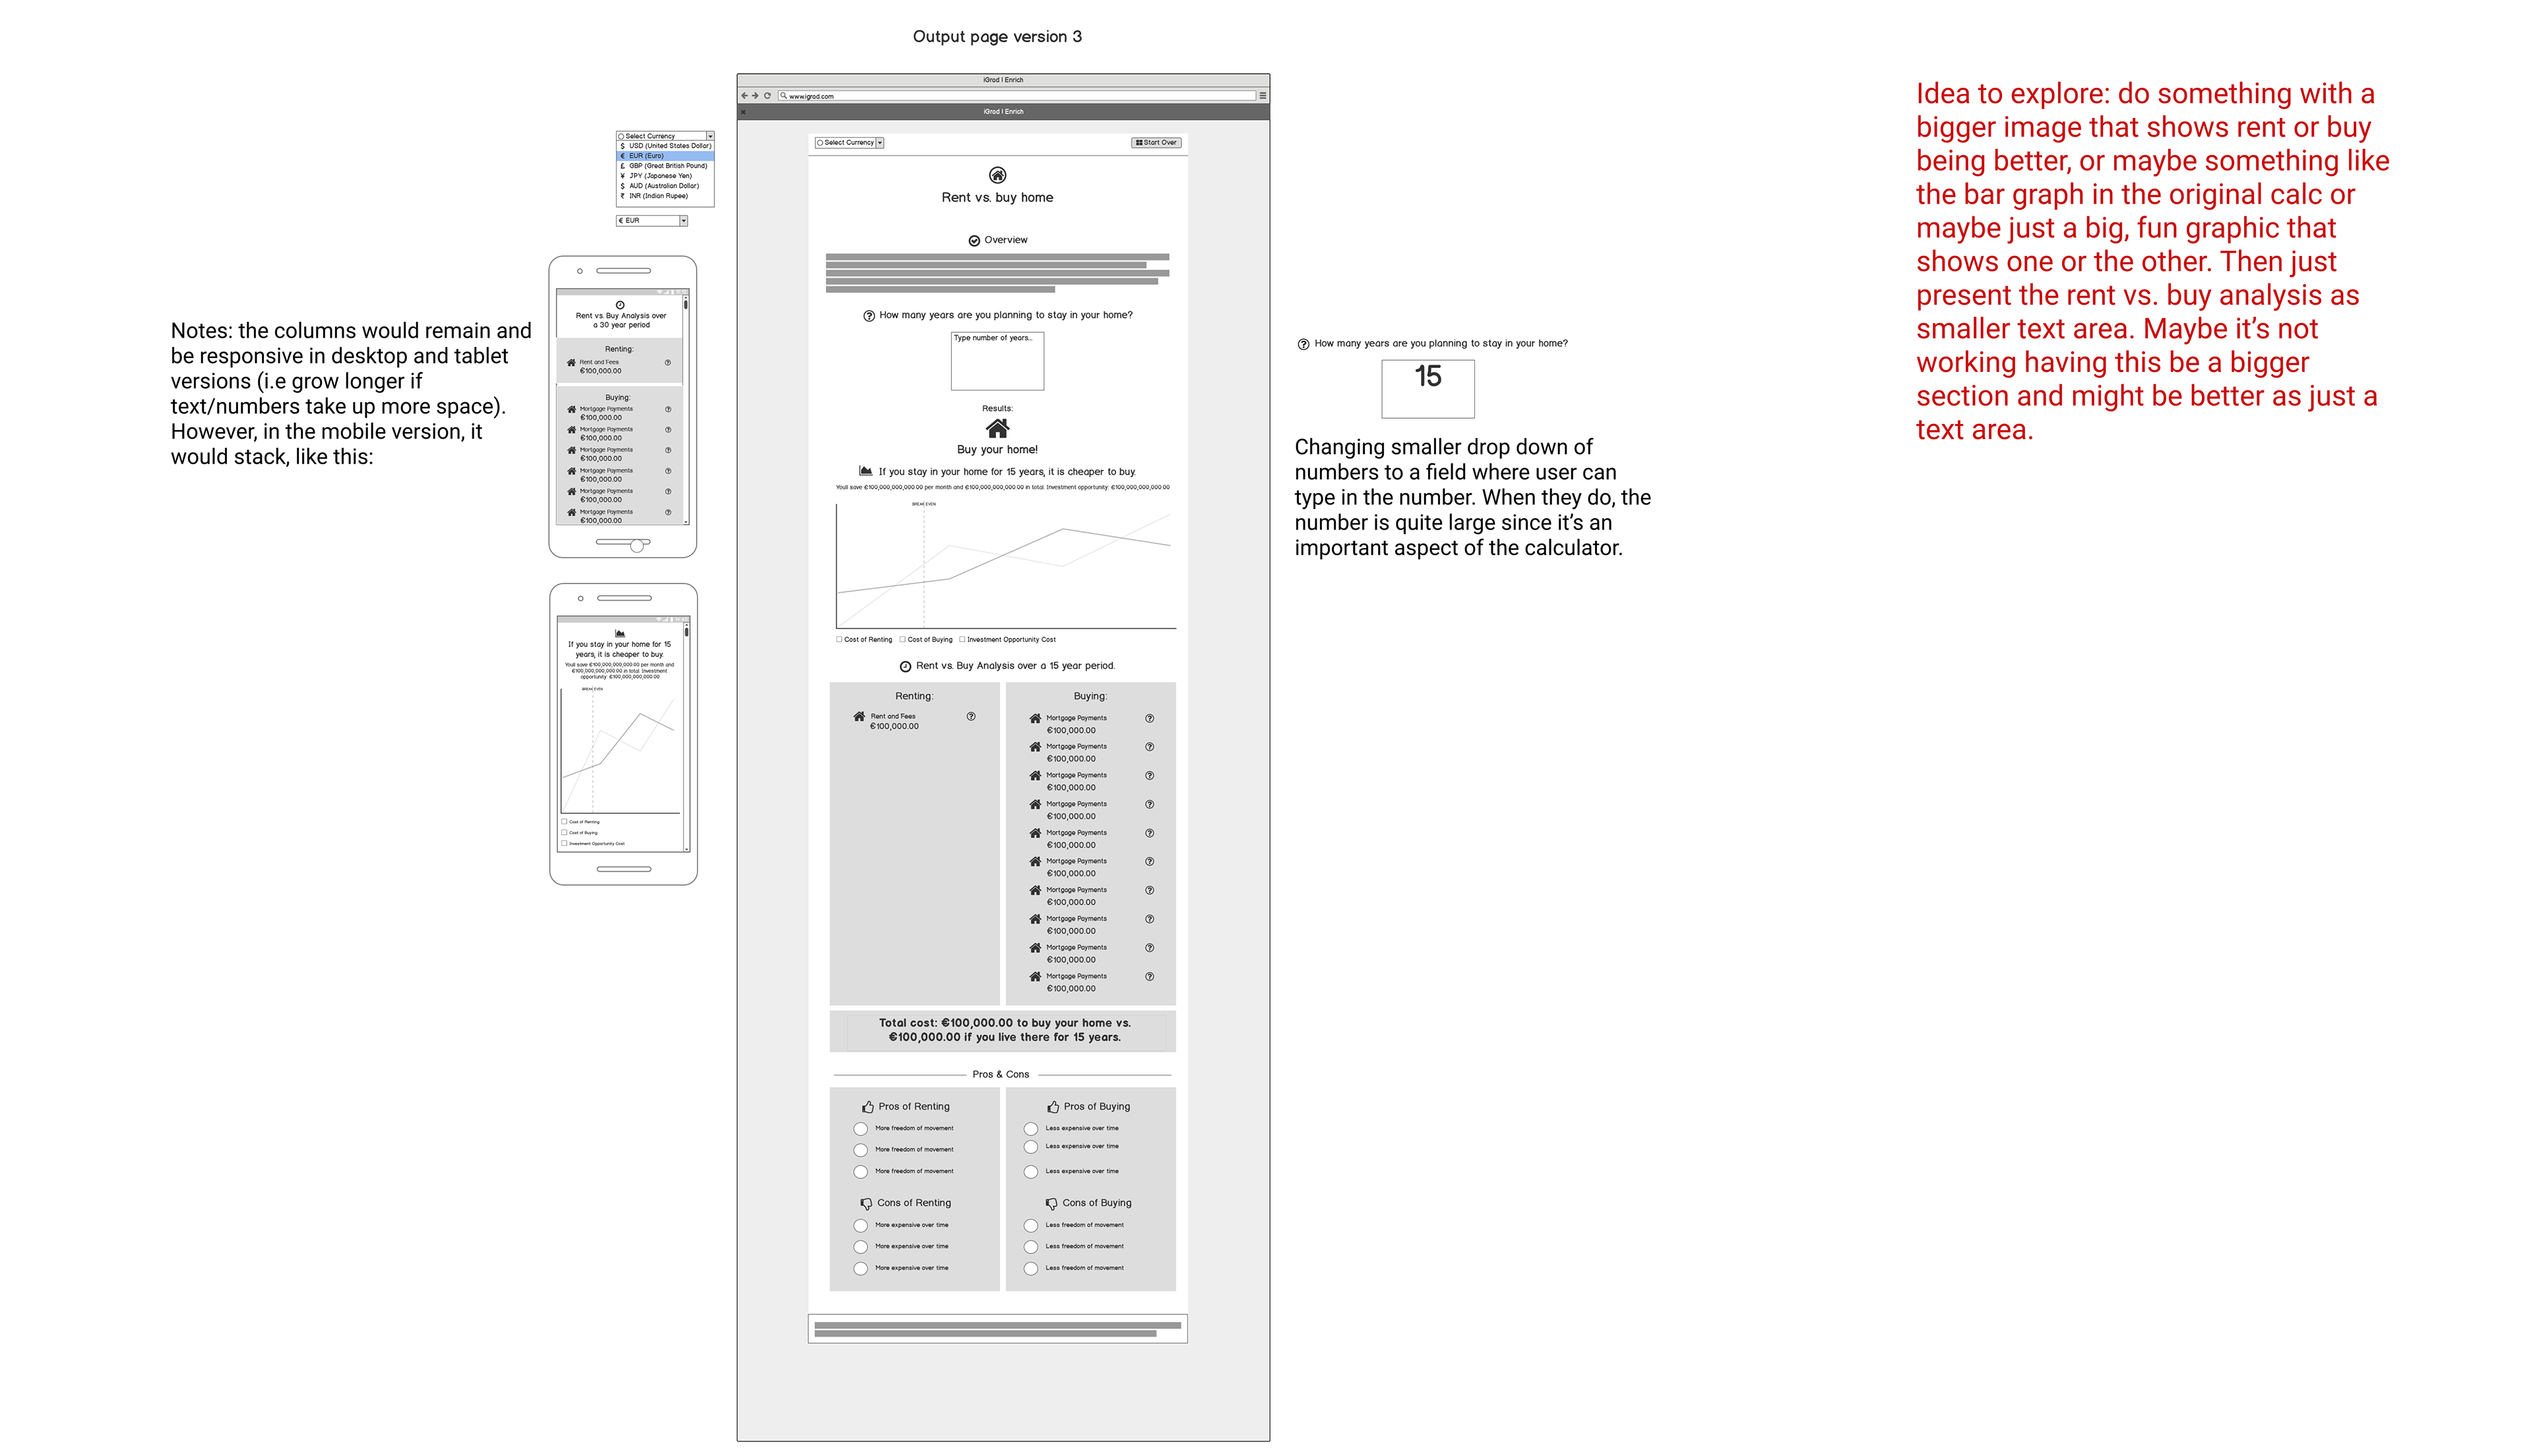
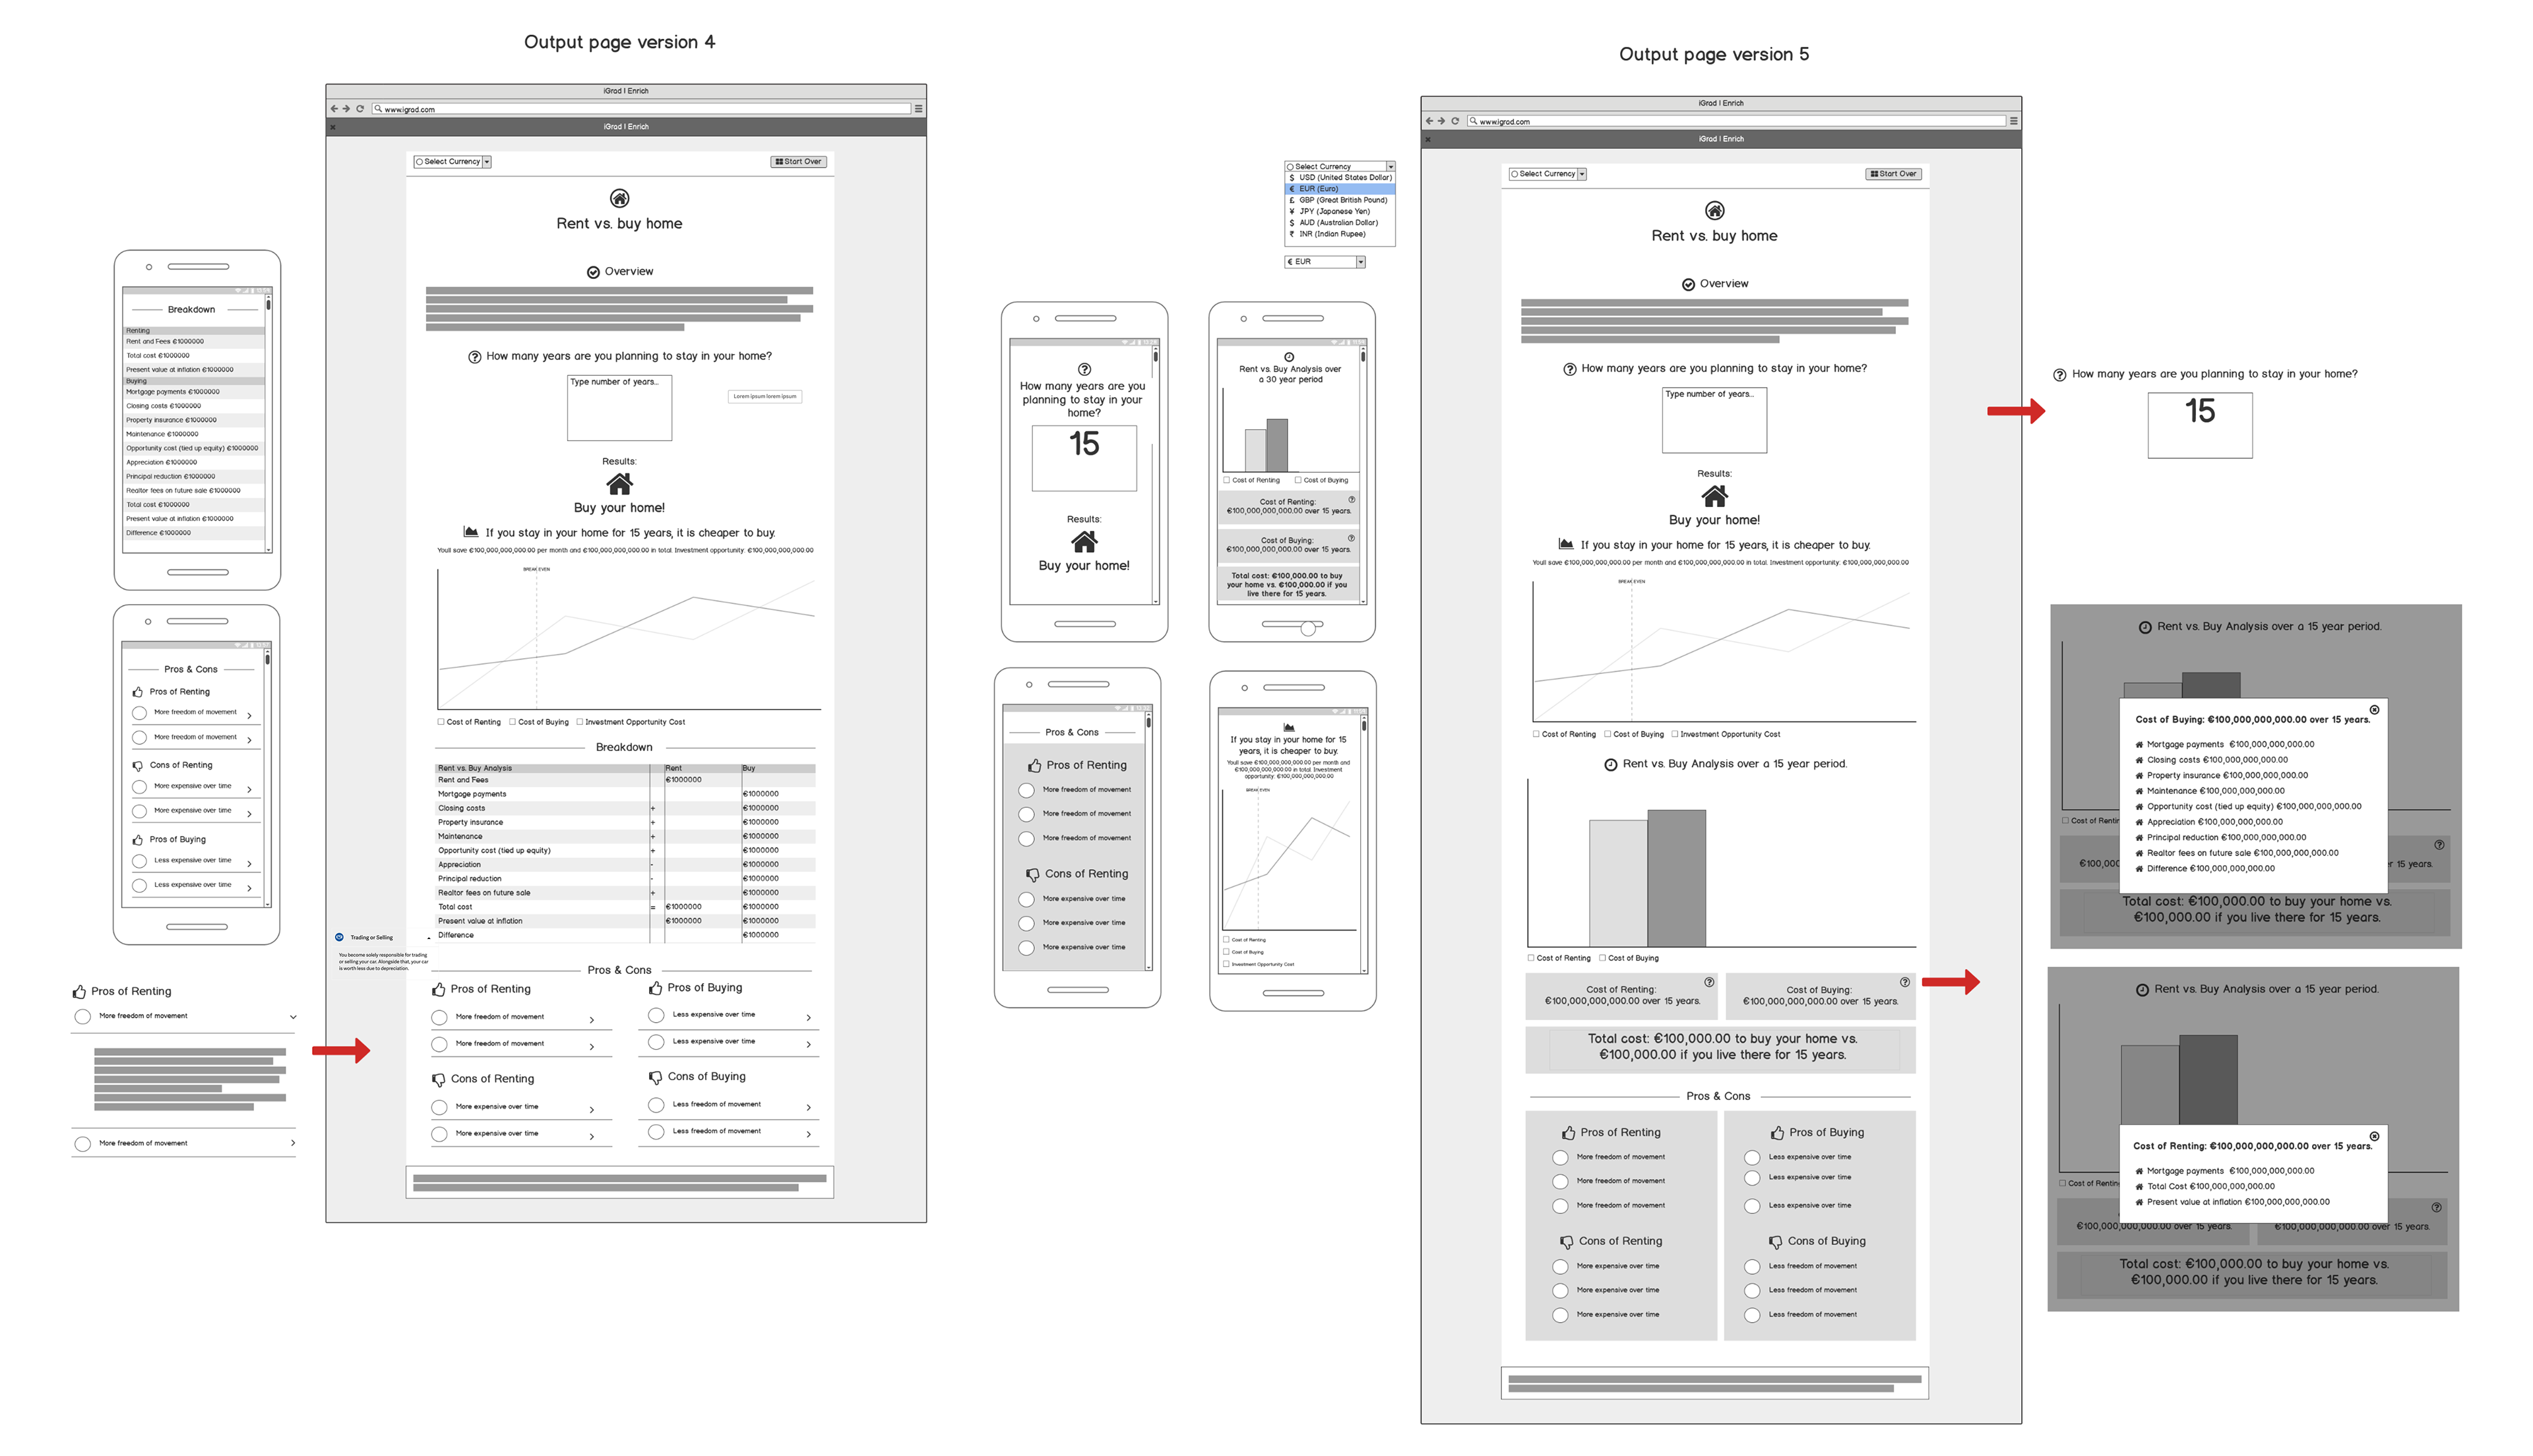
DESIGN ITERATIONS
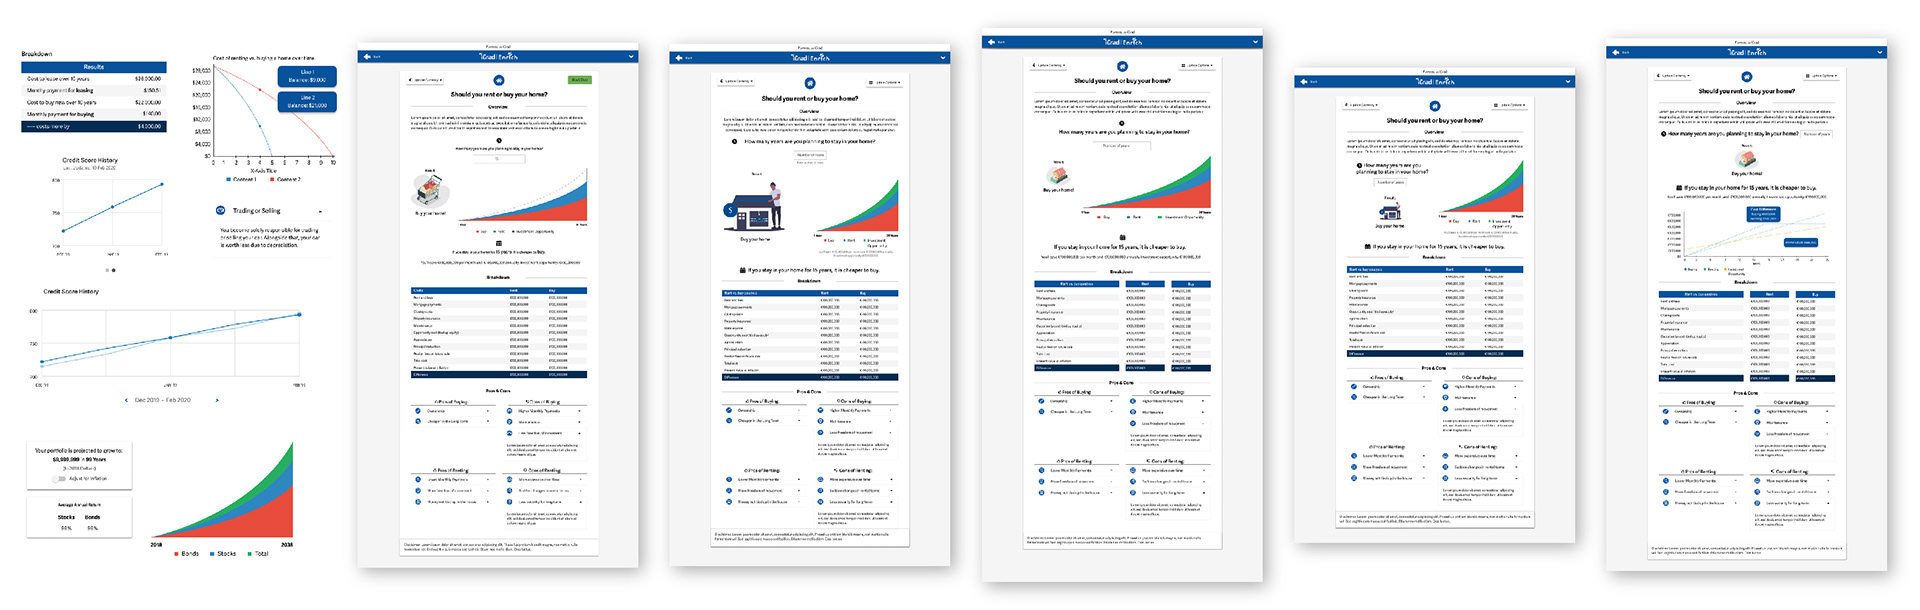
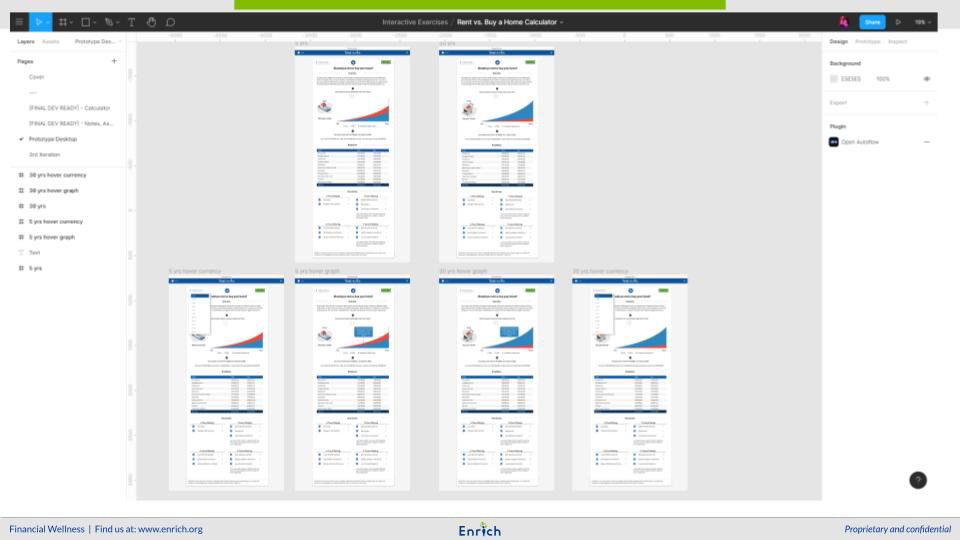
FINAL DESIGNS
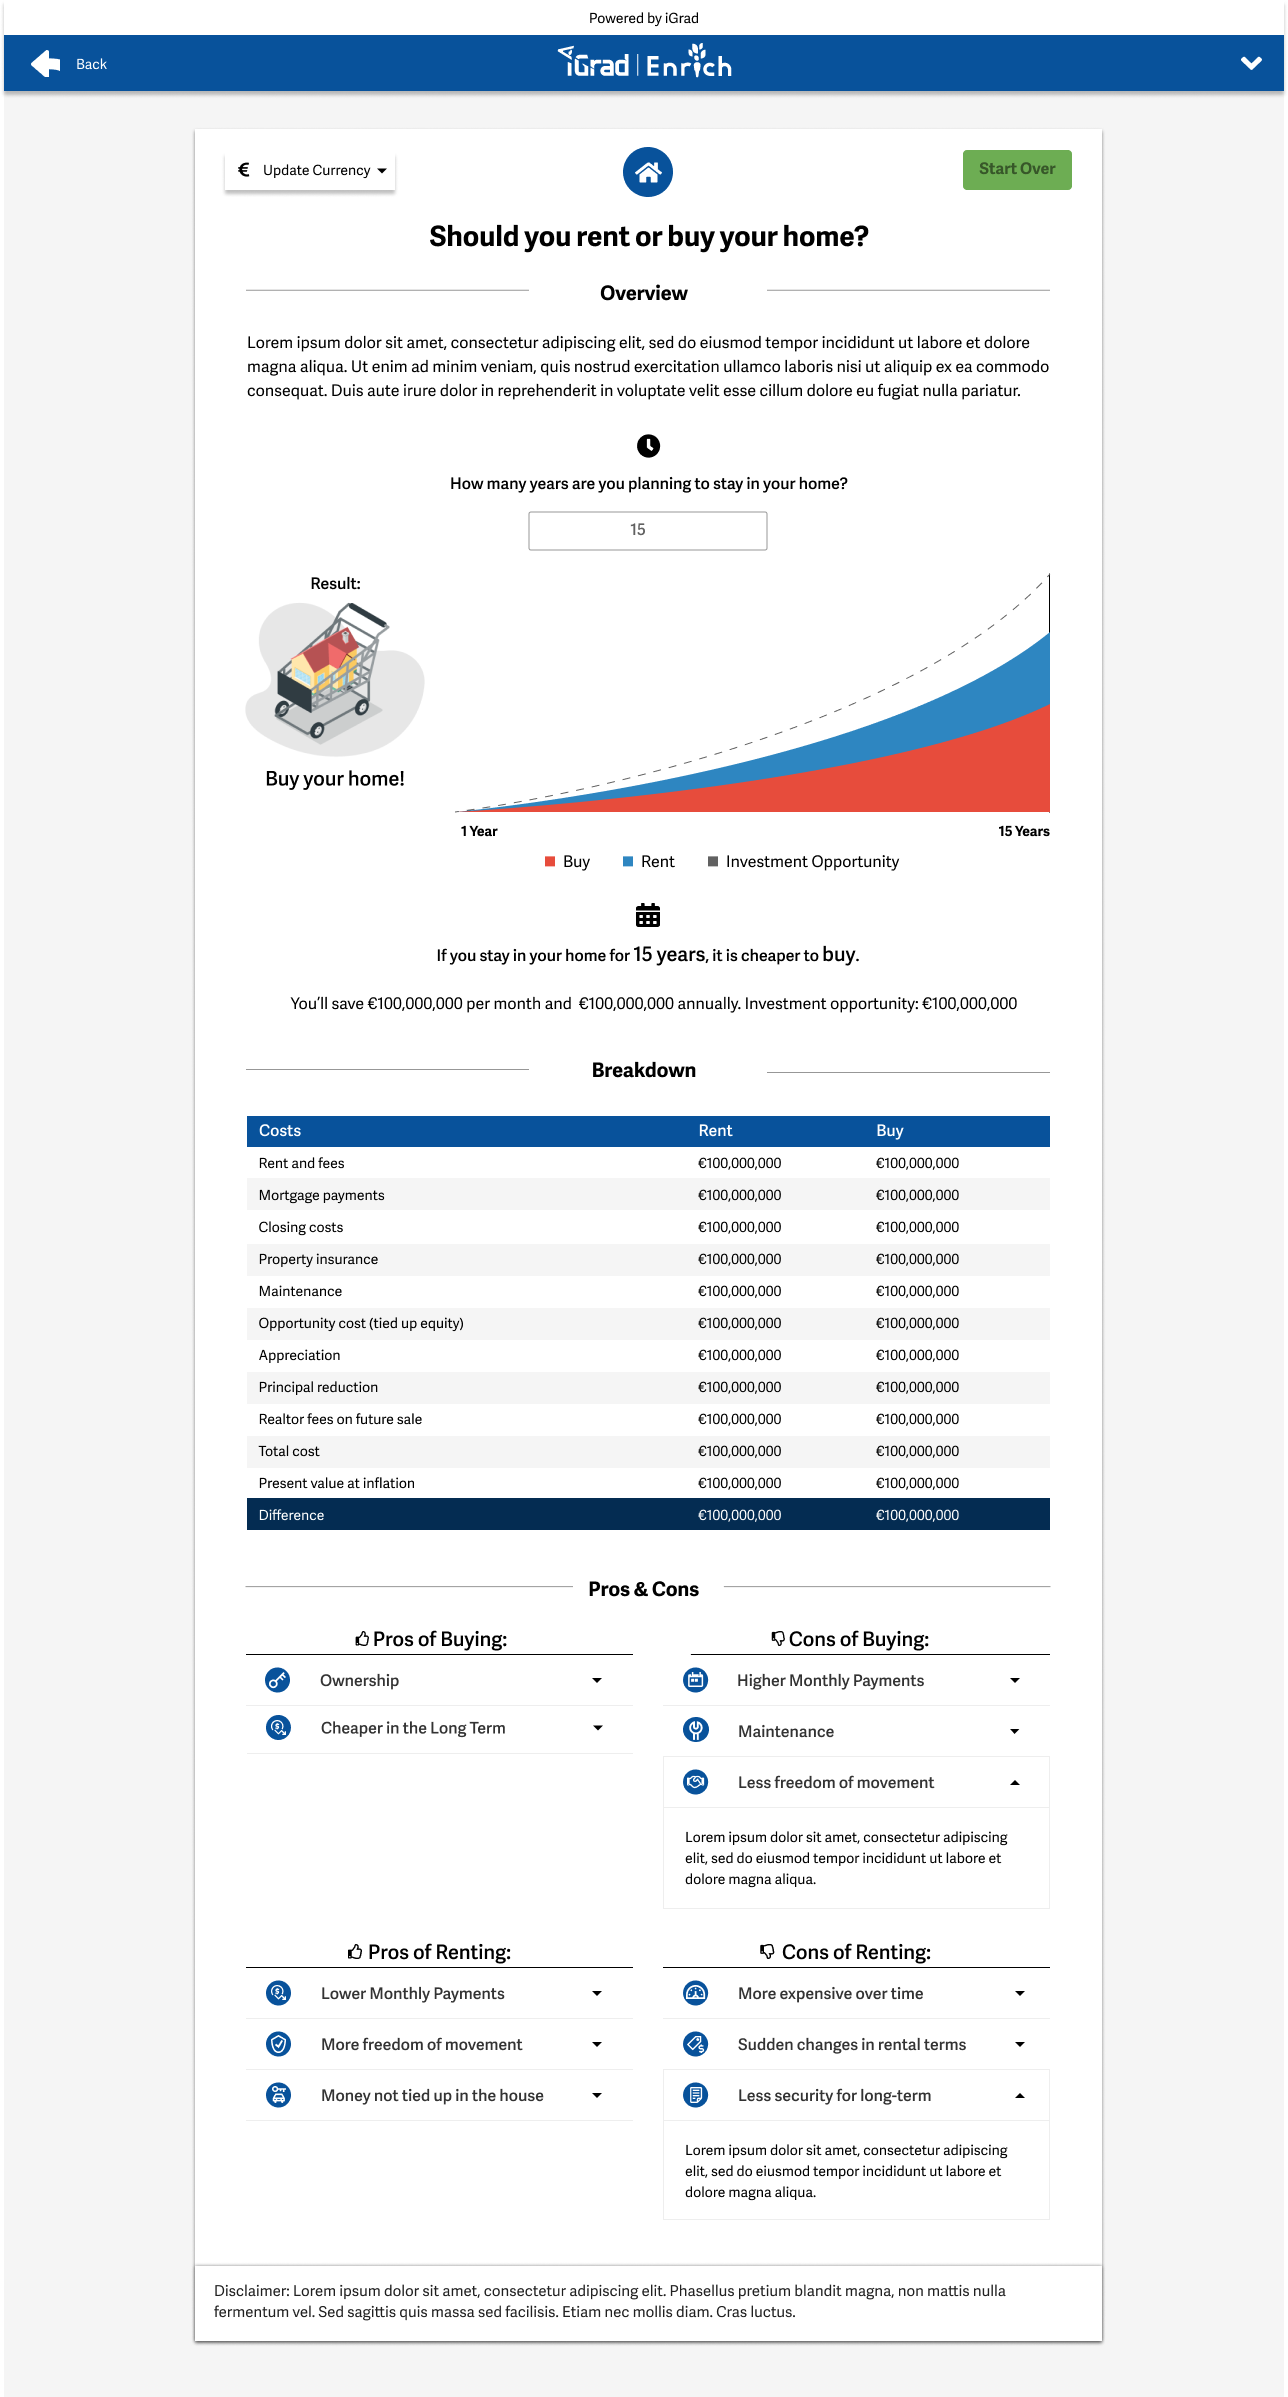
Desktop
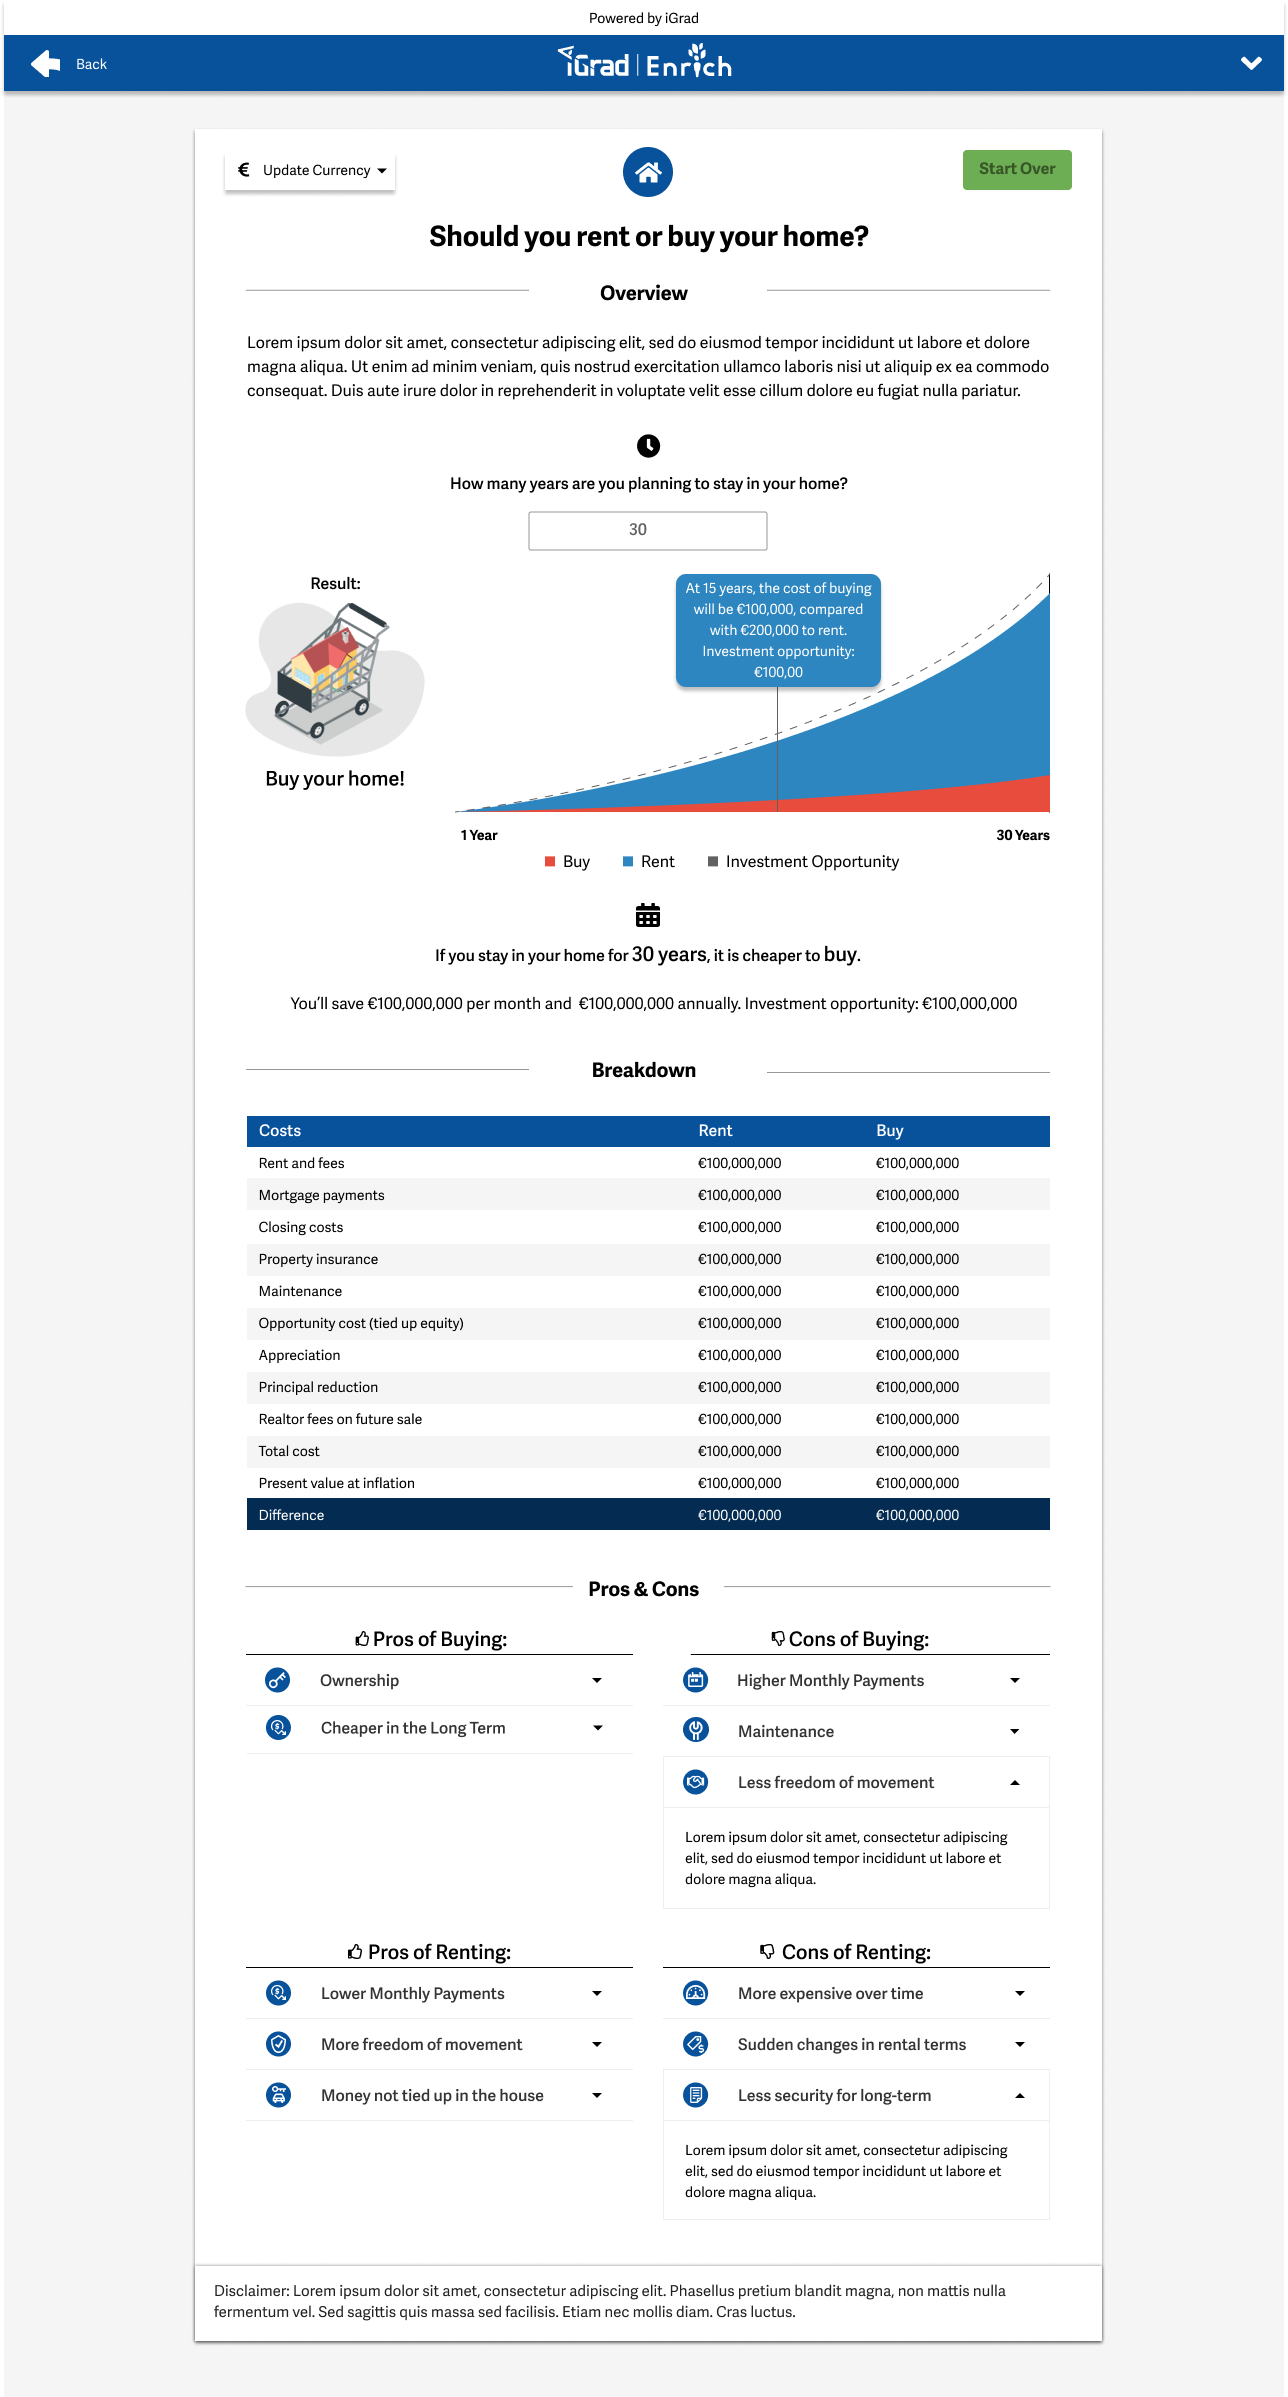
Desktop with hover on graph
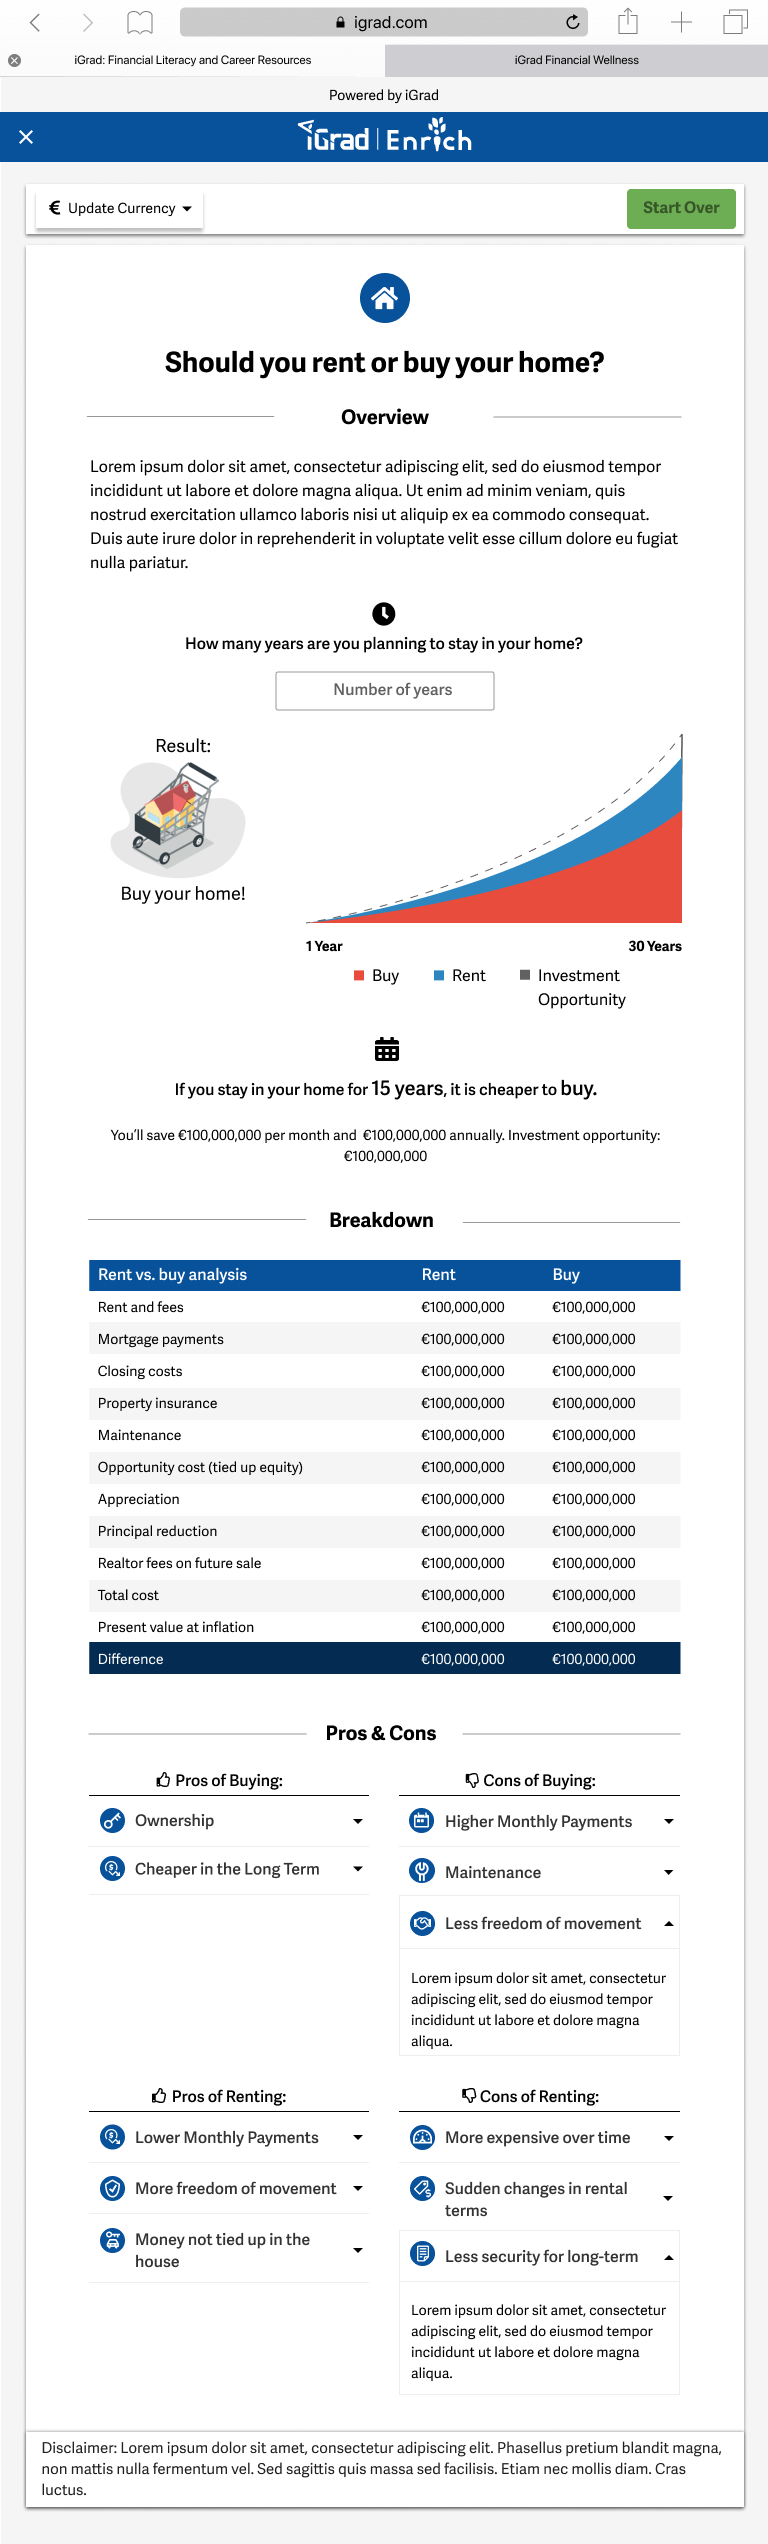
Tablet
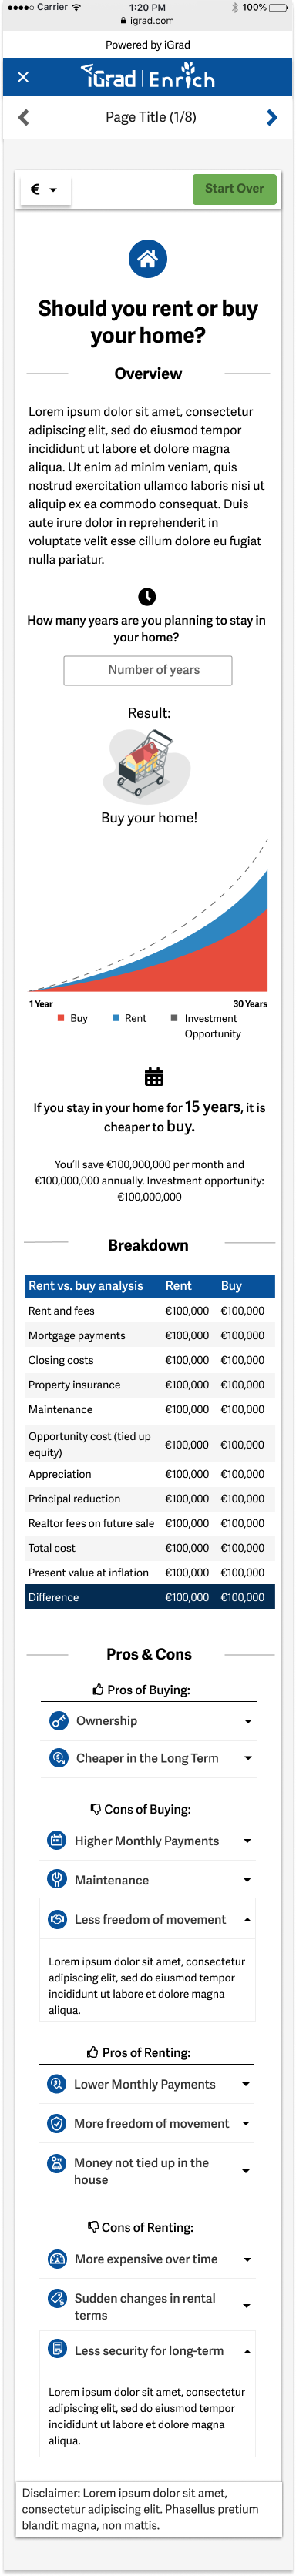
Mobile
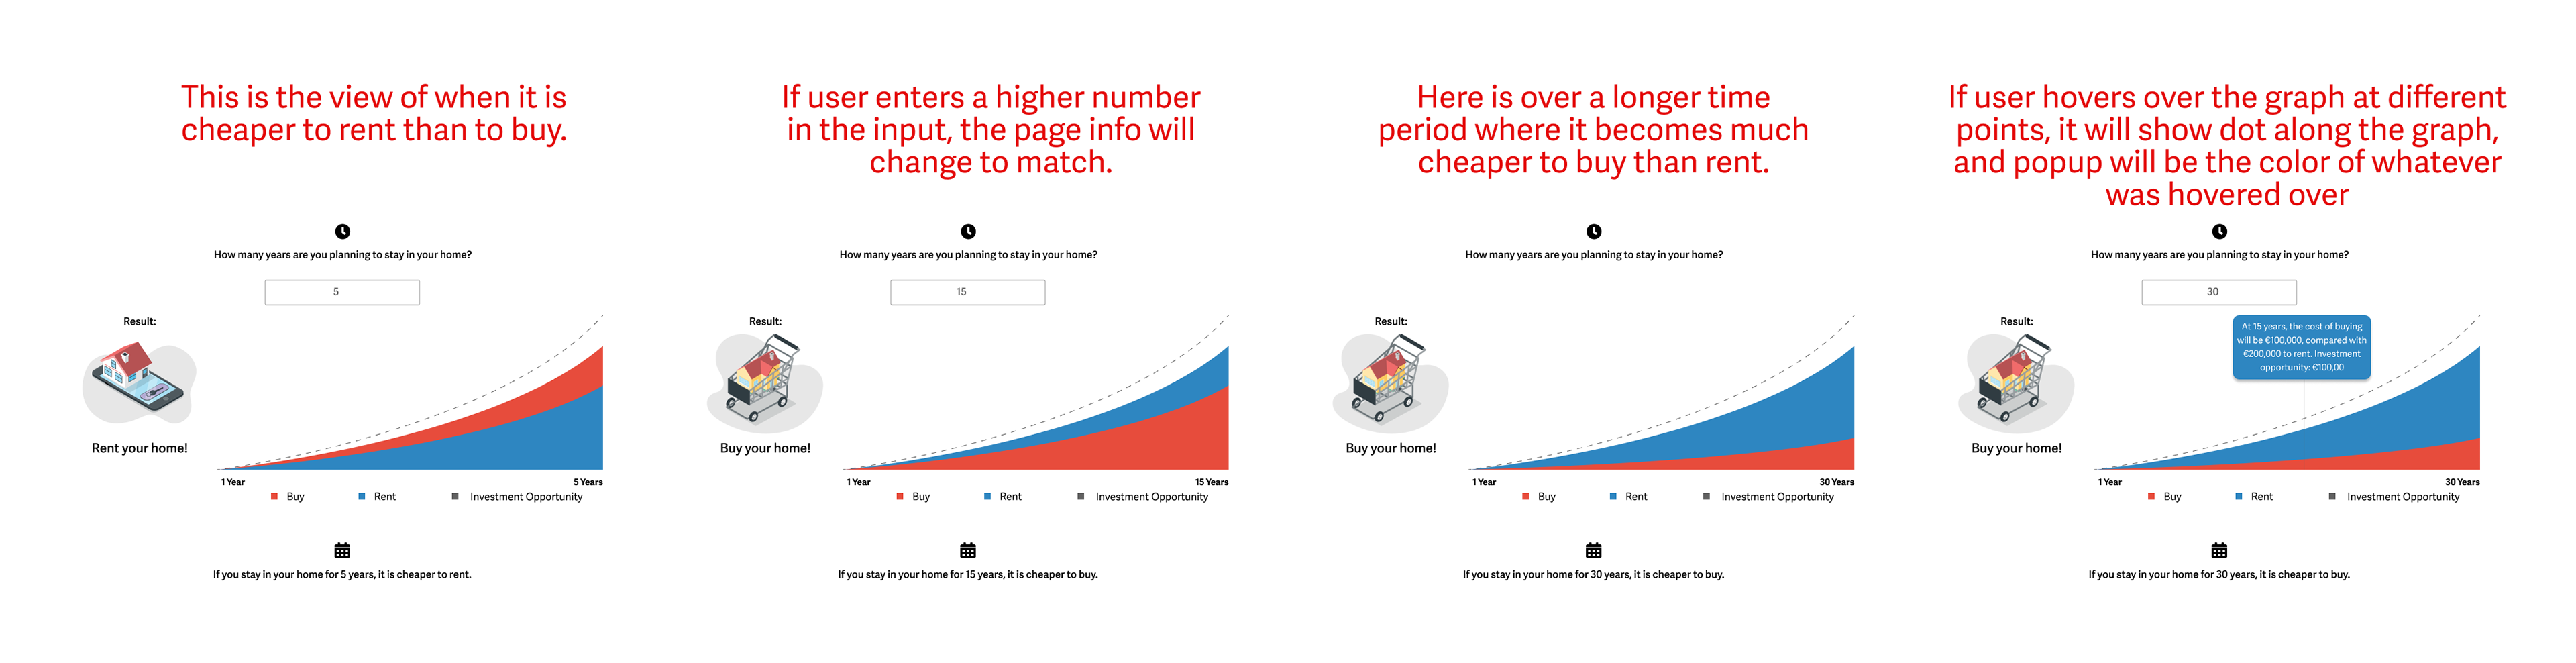
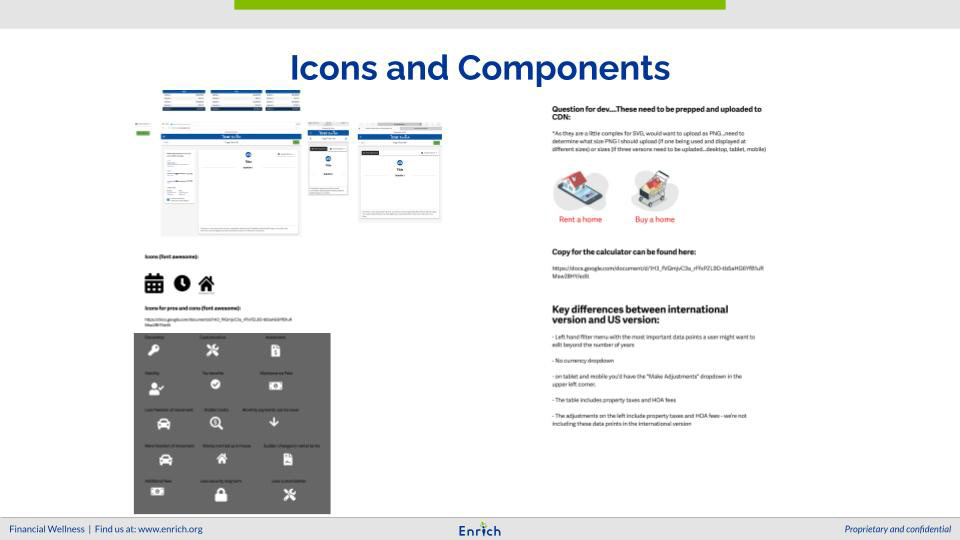
Explanation of graph functionality
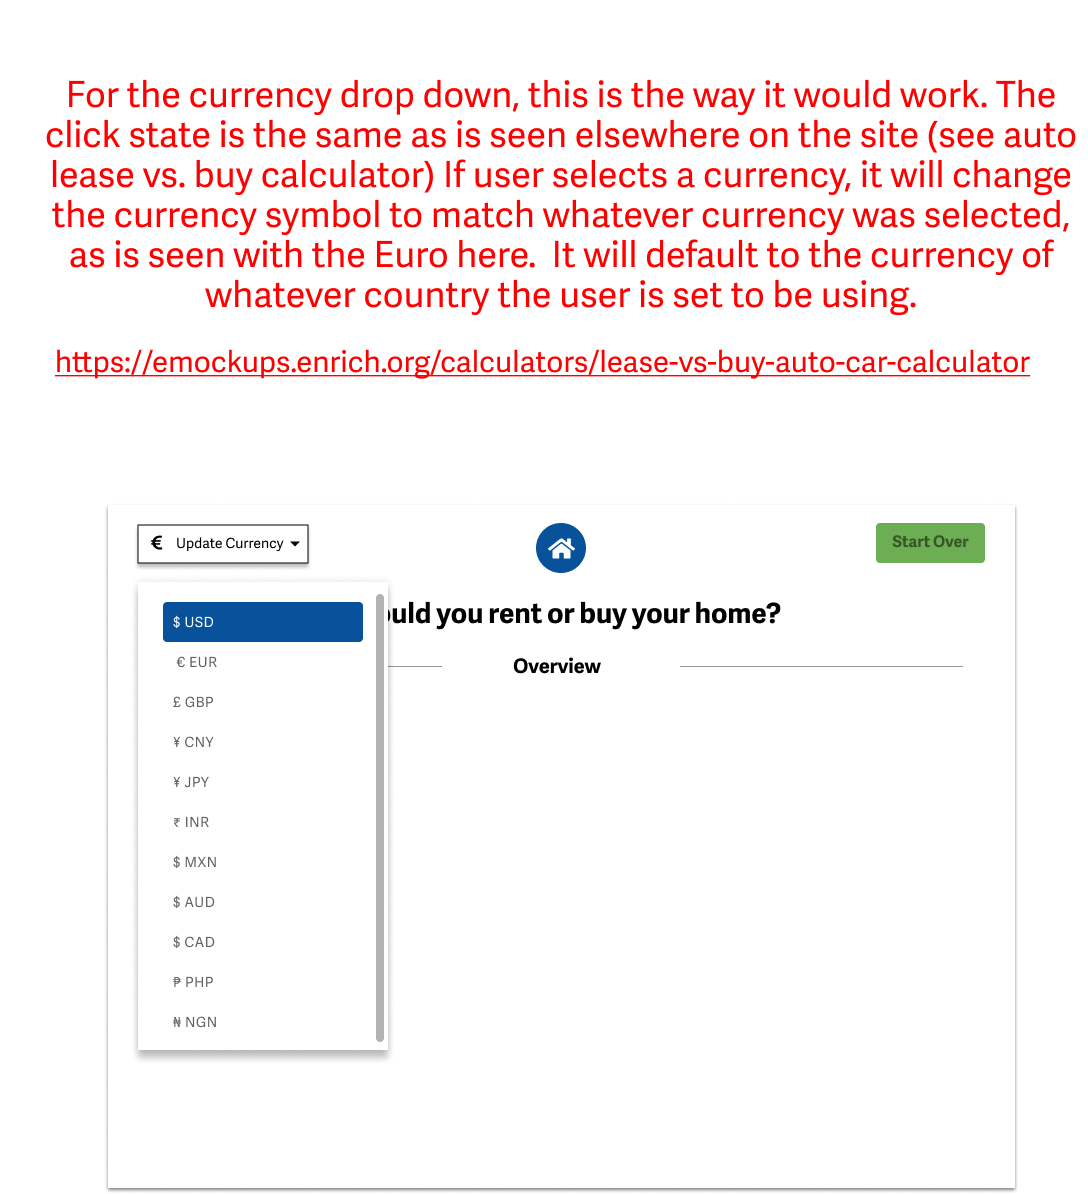
Explanation of currency drop down functionality