The Problem
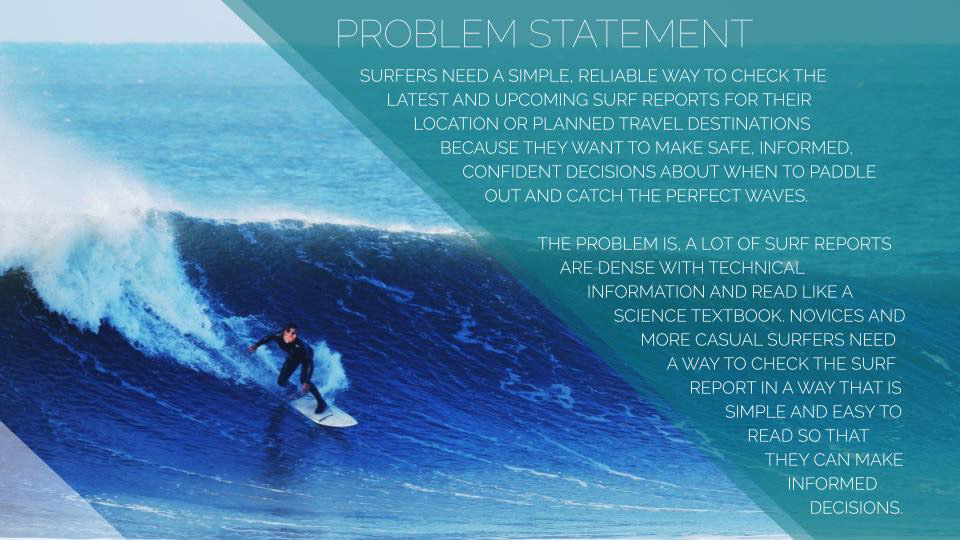
Goals
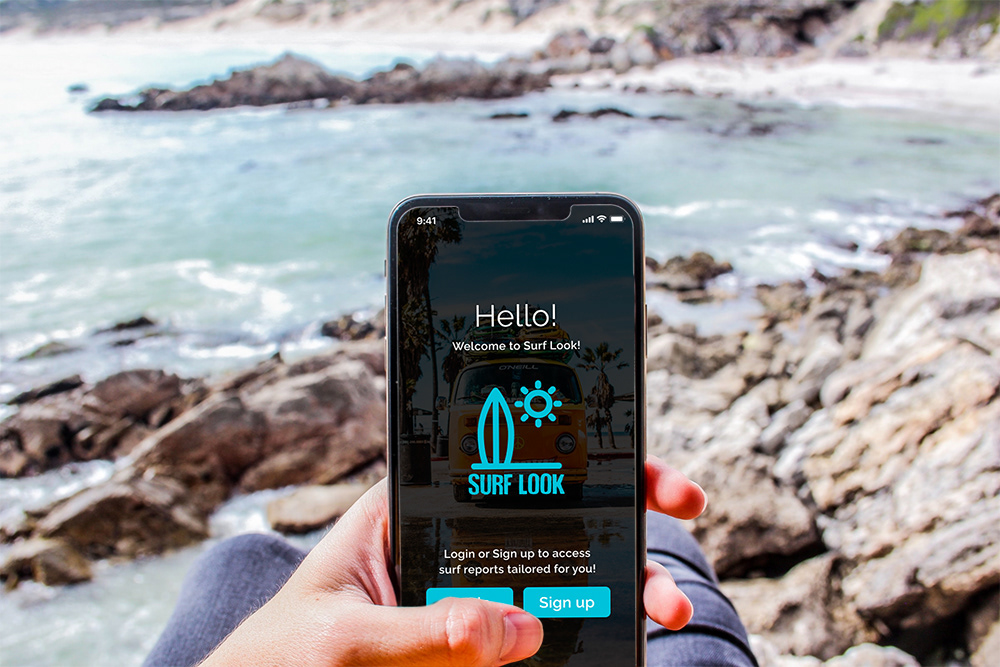
The goal of this project was to create a beautifully displayed and easy to understand wind, wave and weather reports, forecasts and statistics for surfing aficionados. During this project, I went through the entire UX design process extensively in order to create a useful and engaging app.
My Role
UX/UI Designer, UX Researcher

Skills
User Interviews, Competitive Analysis, User Stories, User Surveys, User Research Analysis, Affinity Mapping, User Personas, User Journey Maps, User Flows, Content Auditing, Sitemap, Brainstorming, Usability Testing, Card Sorting, Wireframing (Low, Mid, and High Fidelity), Prototyping
Tools
Figma, Balsamiq, Pen & Paper, Lucidchart, Optimal Workshop, Video conferencing for usability tests and user interviews, card sorting, Google Drawings, Google Slides, Google Forms, Adobe Illustrator, Adobe Photoshop, Miro, Usability Hub
Project Plan (UX/UI)
Phase 1: Business Requirements
Phase 2: Understanding the User
Phase 3: Foundational Design
Phase 4: Usability Testing
Phase 5: Refining the Design
Phase 2: Understanding the User
Phase 3: Foundational Design
Phase 4: Usability Testing
Phase 5: Refining the Design
Business Requirements
I conducted a full competitive analysis on some of the main competitors in the surf report space and compiled their competitor profiles, key objectives as an organization, overall business strategy, market advantages and market profiles. I then conducted a SWOT analysis to determine each organization’s main strengths, weaknesses, opportunities, and threats in the industry. Next was a UX analysis to analyze each company’s usability, layout, navigation structure, compatibility, calls to action, and differentiation in the market. This helped me to fully understand what the competition was doing and helped me to formulate some hypothesis on how I might structure SURF LOOK.
To view my the full report on my analysis, you can click here.
Understanding the user
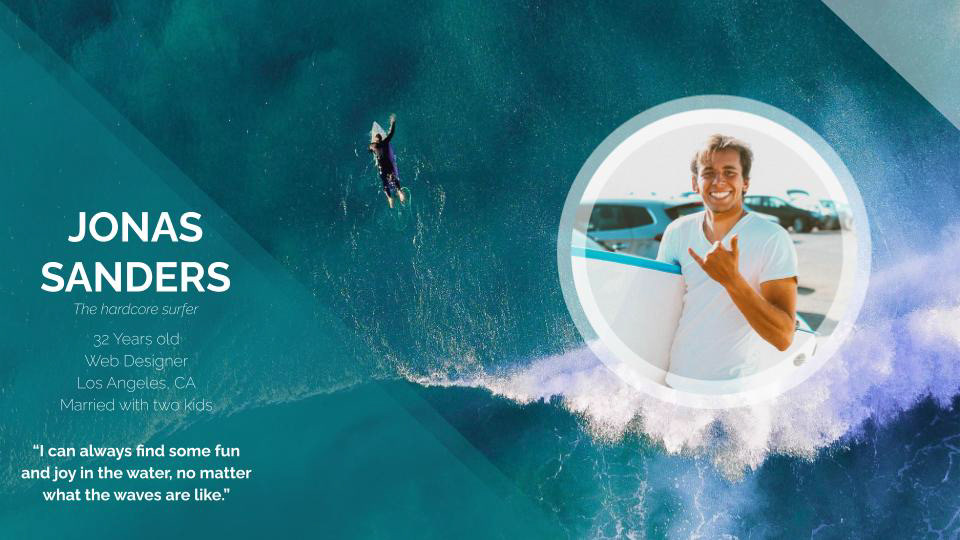
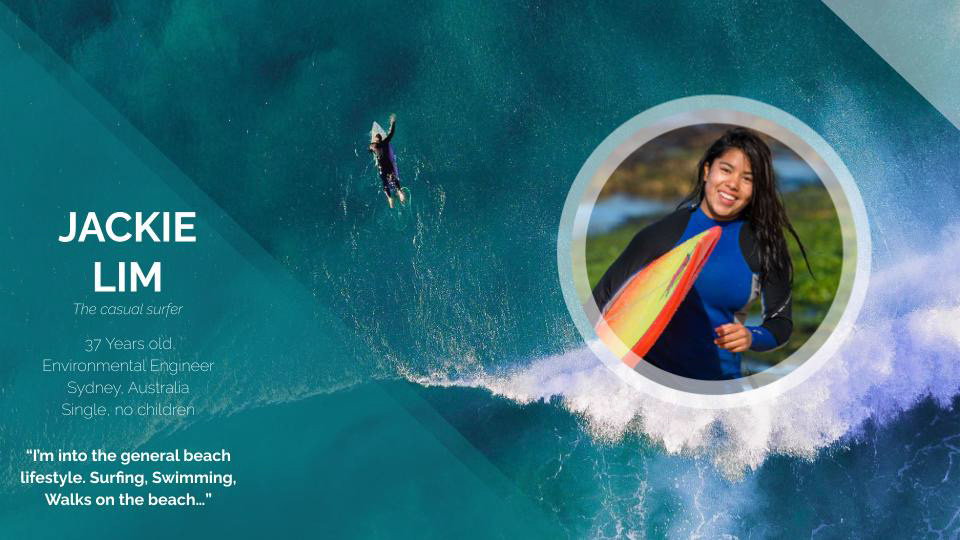

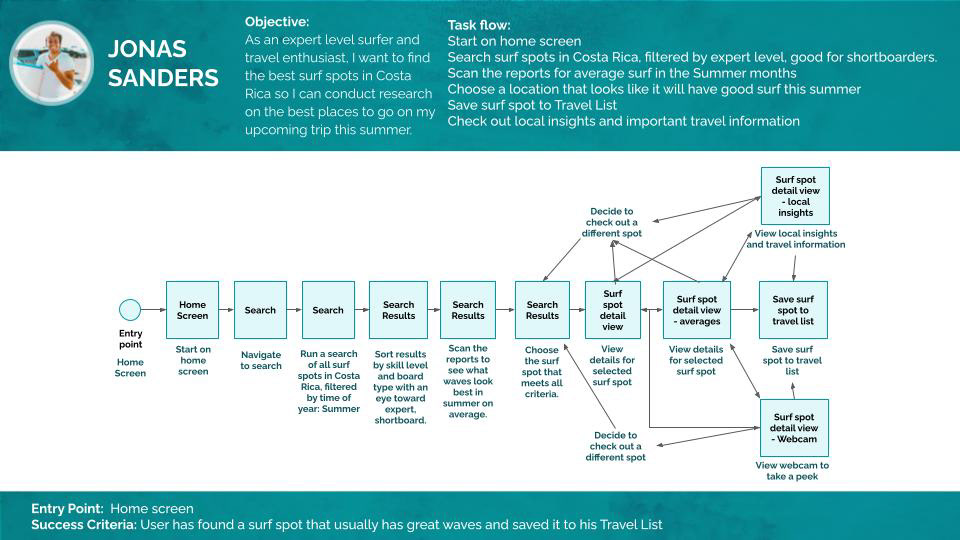
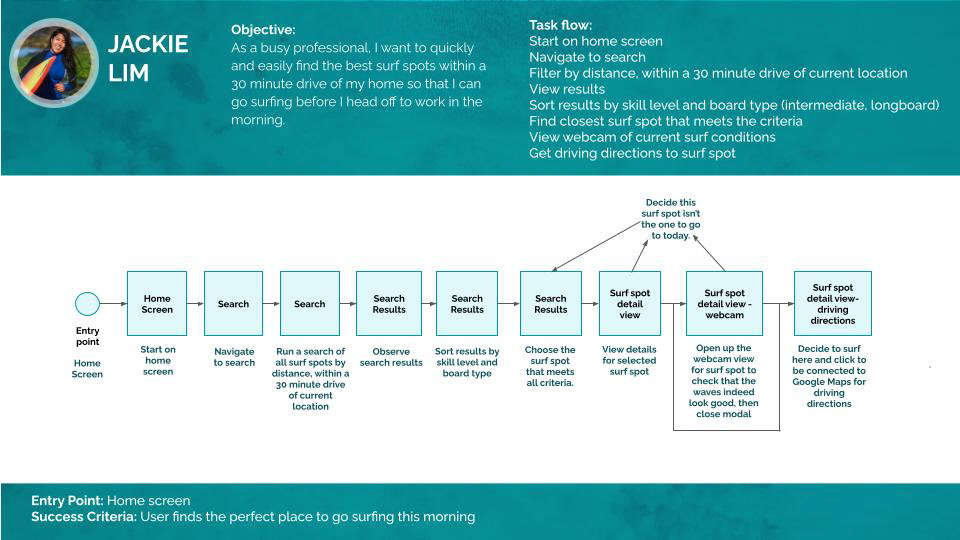
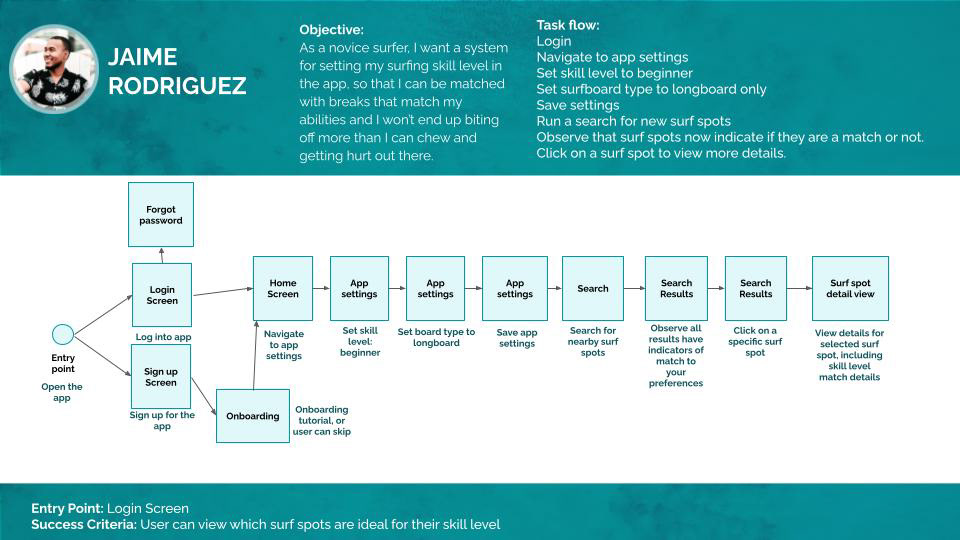
This part of the project focused on understanding and evaluating who the user is. In this part of the project, I also conducted extensive user interviews and surveys of surfers at all skill levels and conducted a user research analysis to explore the data from my findings, sort and map the data, and identify key user insights. This included an affinity mapping exercise, which helped me to better understand the users and what they want out of a surf report. After gathering data, I created user personas which matched the target demographics for the SURF LOOK app and identified each persona’s needs, goals, motivations, frustrations, and activities. I analyzed their device usage and crafted a hypothesis statement for each persona. I then created user journey maps which took each persona through a scenario where they might want to use the SURF LOOK app and analyzed their goals and expectations as they navigated through the app. This then led to the creation of user flows and task flows, which helped me to craft a mobile-first design plan.
Scroll through this PDF to view the user personas, user journey maps, user flows, and the mobile-first design plan.
Foundational Design
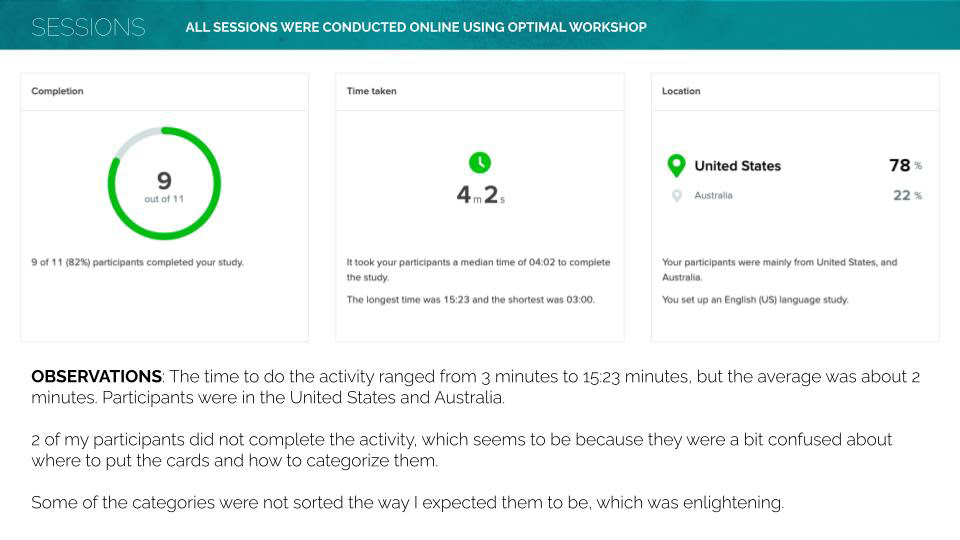
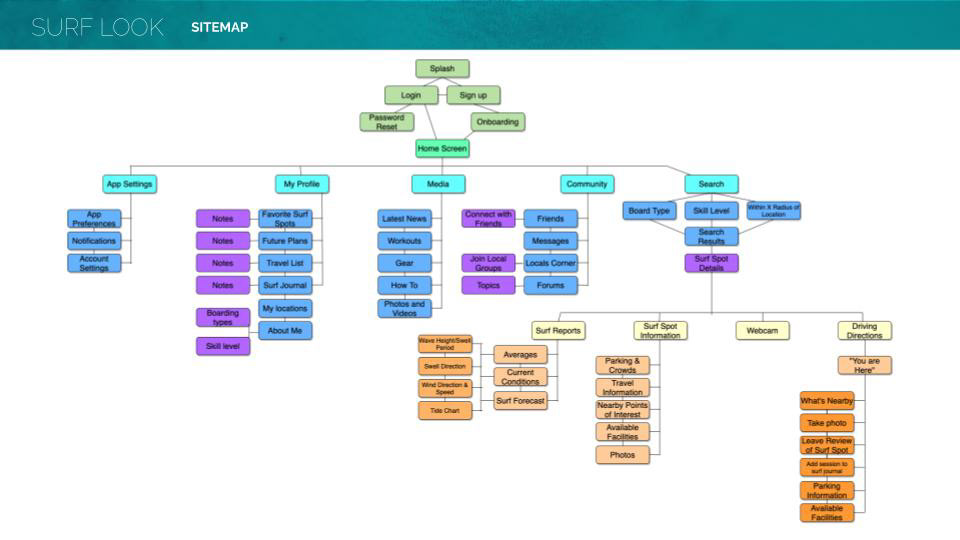
In order to successfully illustrate the technical articulation for SURF LOOK’s information architecture, I went through a series of exercises aimed at refining the design. I started with the creation of a sitemap which I then validated through a card sorting exercise with 11 participants using Optimal workshop, which led to some refinements of the sitemap.
You can view the full details of the card sorting exercise here.
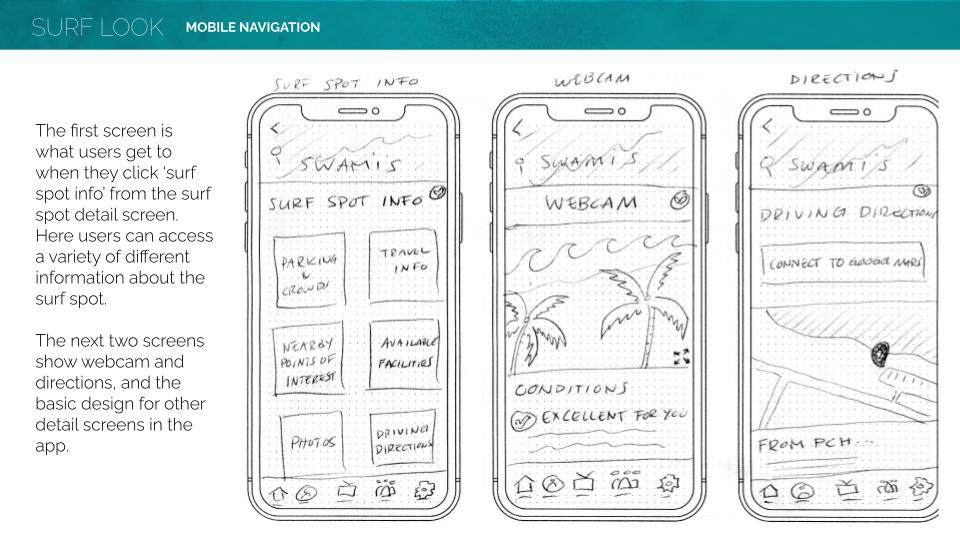
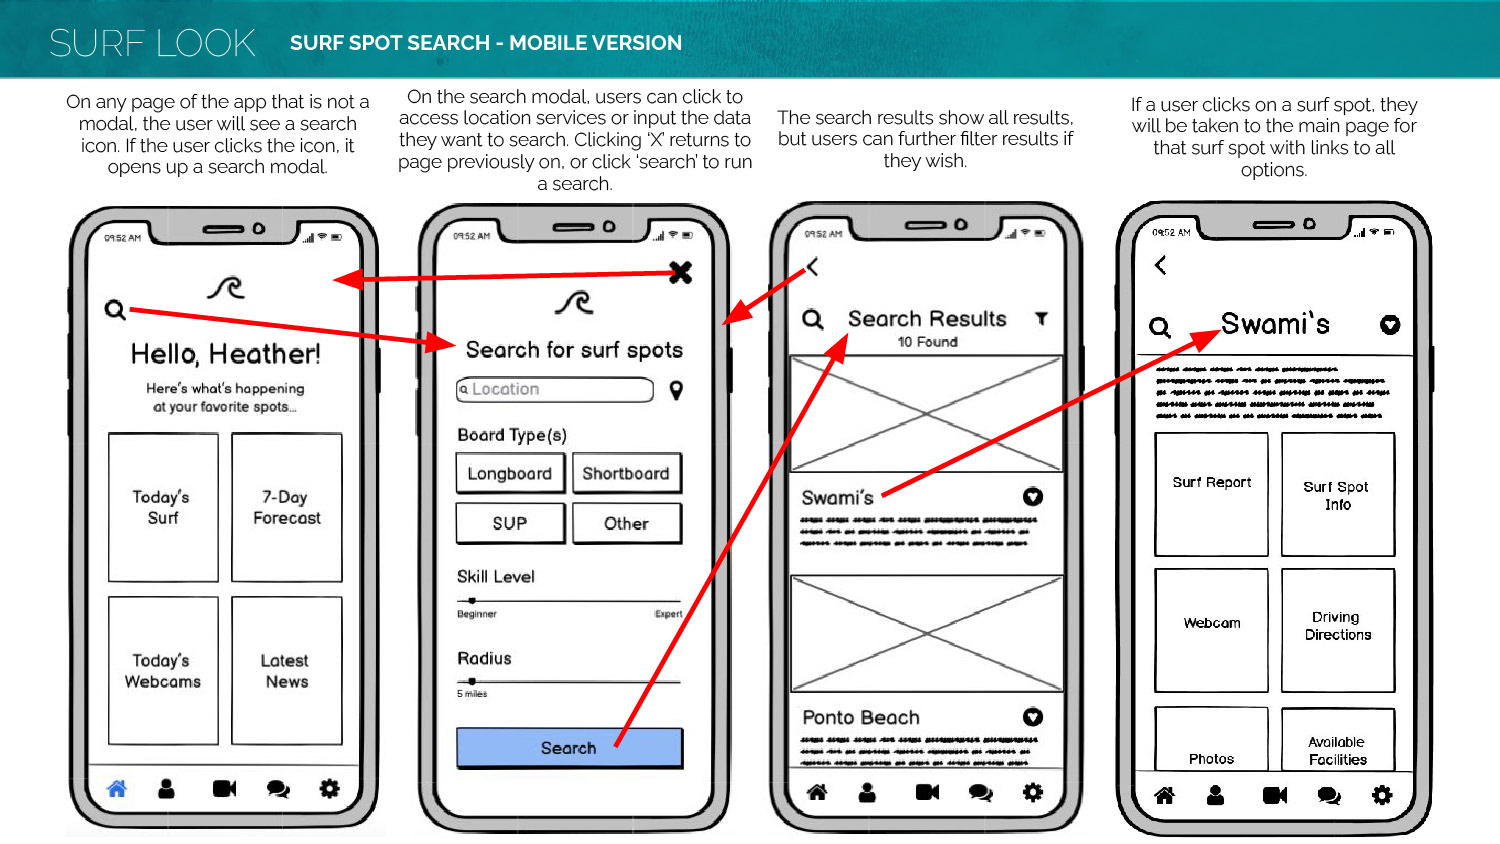
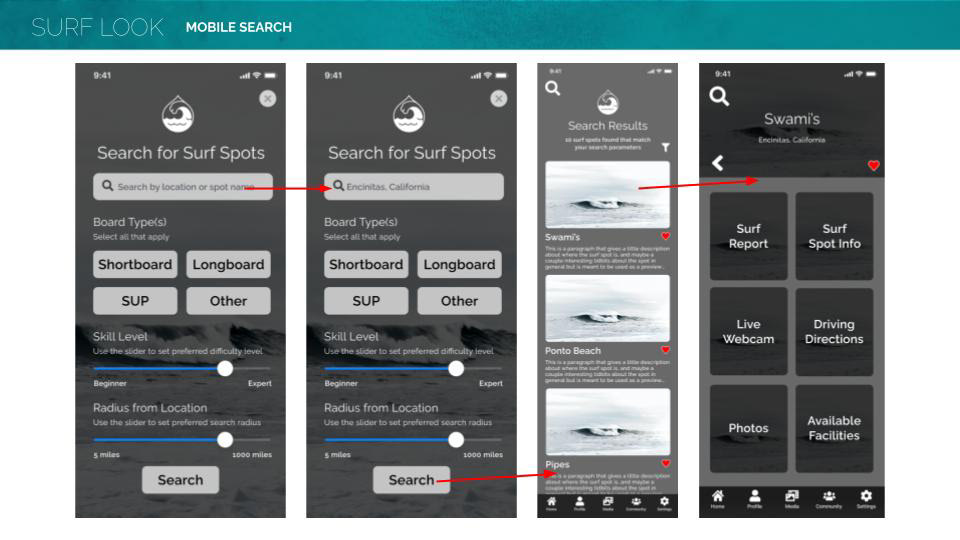
After that step, I started sketching out the app with low fidelity, hand-drawn wireframes and then set up design patterns for both the mobile and desktop versions of the app. I continued with refined versions of those initial wireframes created in Balsamiq and prototypes in both the mobile and desktop versions of some key features of the app, such as the surf spot search, home page, and the main surf spot pages. This helped me to plan out the layout and user flow of each of these features. After doing some testing and refinement of those wireframes and flows, I moved on to setting up the wireframes to be more high fidelity in Figma, which helped me to really visualize what the app might look like.
usability testing
The next step in the process was to put SURF LOOK’s designs to the test! I conducted usability testing from start to finish, working with test subjects, analyzing test results, making improvements on the designs based on those results, and planning future tests.
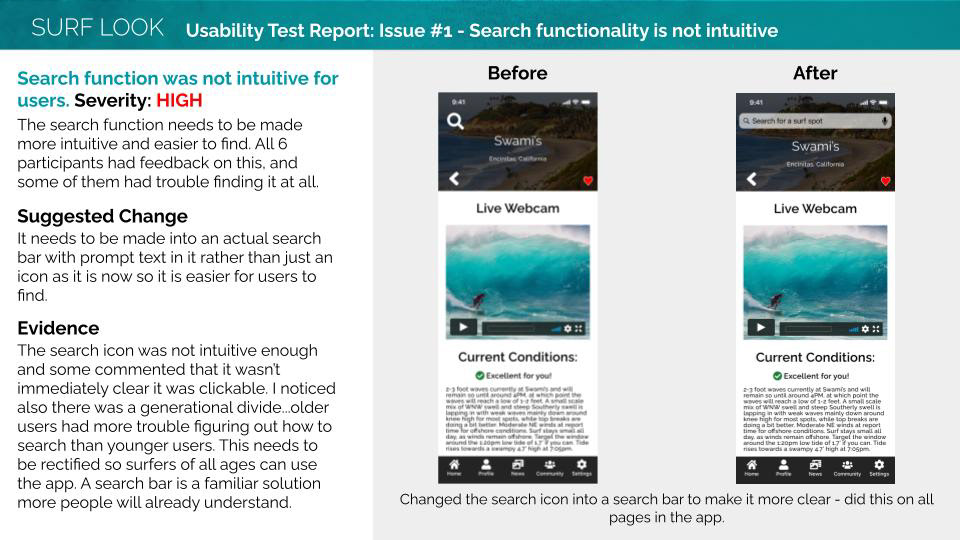
For this step, I first came up with a usability test plan, outlining the goals, test objectives, methodology, and schedule of testing as well as the metrics by which the test would be evaluated (using Jakob Nielsen’s scale). Next I set up the test script, and conducted the tests with 6 participants via remote video conferencing calls. After the tests were completed, I analyzed the results using a rainbow spreadsheet and gained insights on improvements to make to the app based on those findings.
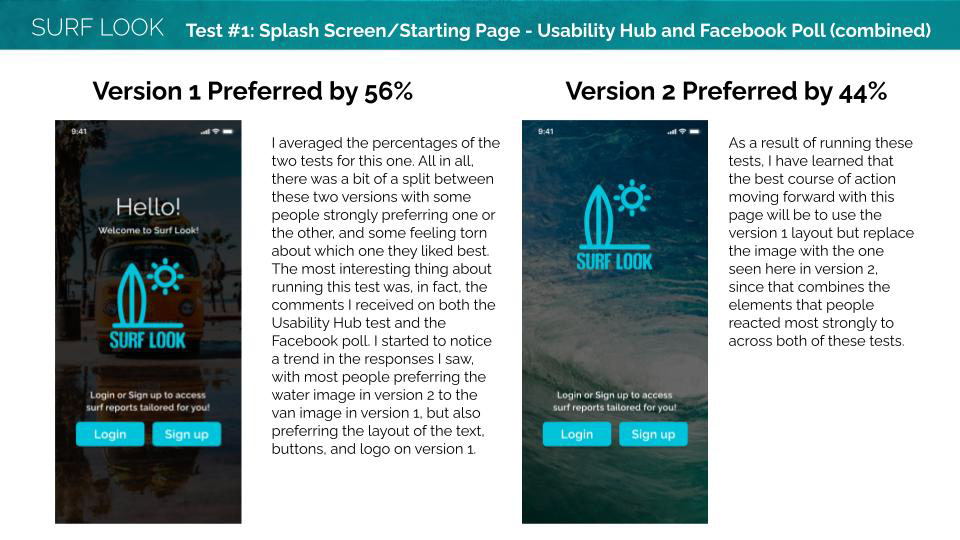
In addition to usability testing, I also conducted some preference tests on several screens of the app in order to gain insights on which designs to use. I tested three different screens through a combination of usability hub participants as well as by conducting an informal poll on social media. Both tests gave me valuable insights on additional refinements to make to the app’s design.
To view the full report from this stage, you can click here.

Refining the Design
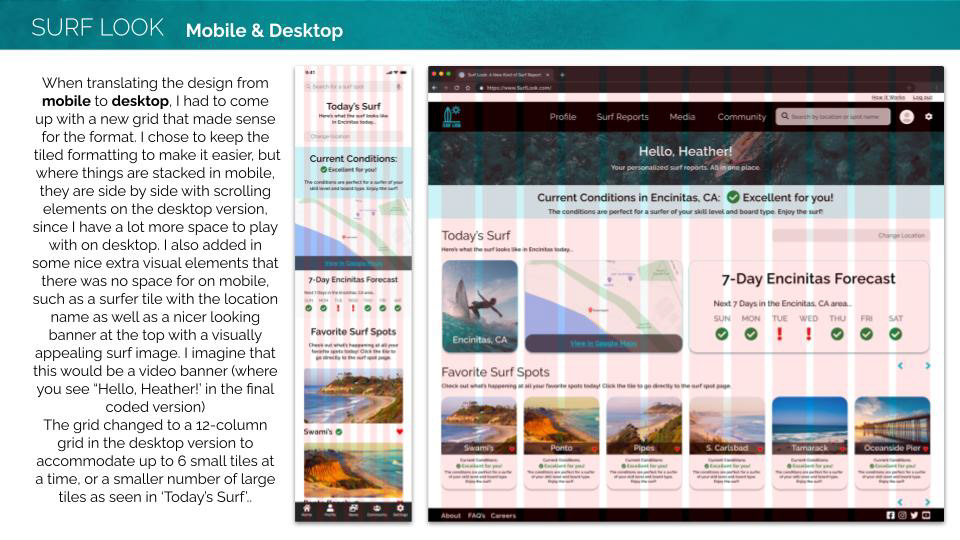
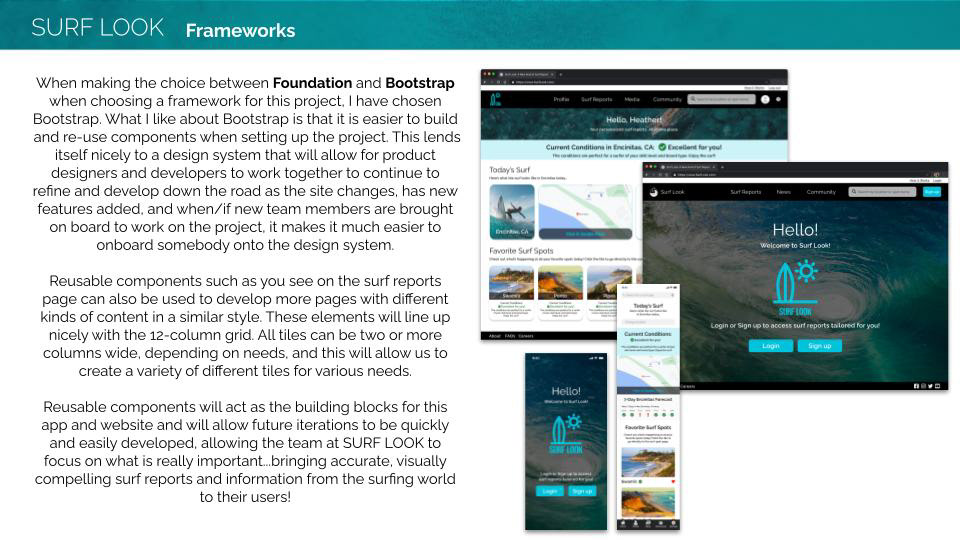
After the usability test and preference test results came in, I set to work making refinements to the app design. In this stage, I created a grid system for the design on both the mobile and desktop versions in order to make sure everything aligned well, and decided which responsive framework to go with. In this case, I determined Bootstrap would be the best because it is easier to build and re-use components when setting up the project, which lends itself nicely to setting up a design system for SURF LOOK which will allow Product Designers and developers to work together to continue to refine and develop the app over time.
This stage also encompassed design documentation, pattern libraries, creating a design language system for SURF LOOK, and preparing everything for dev handoff.
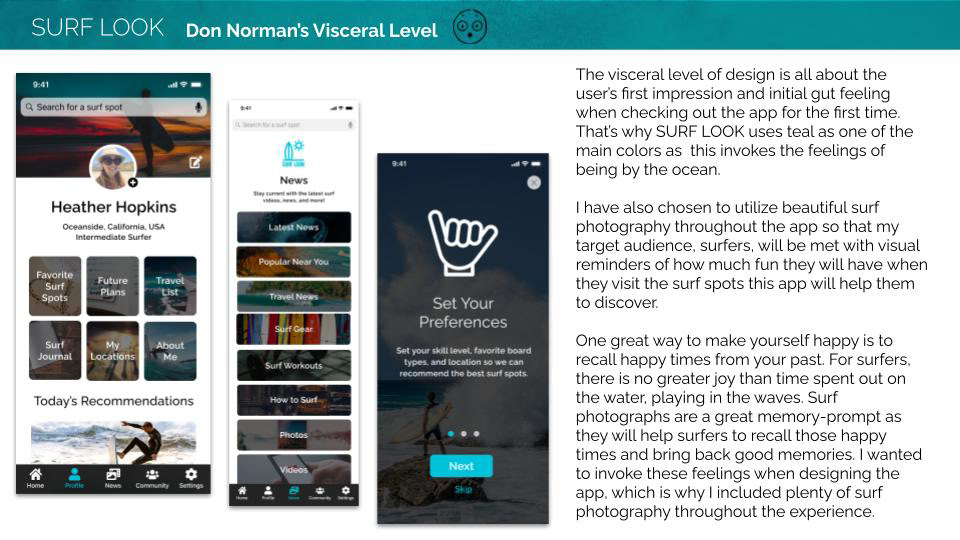
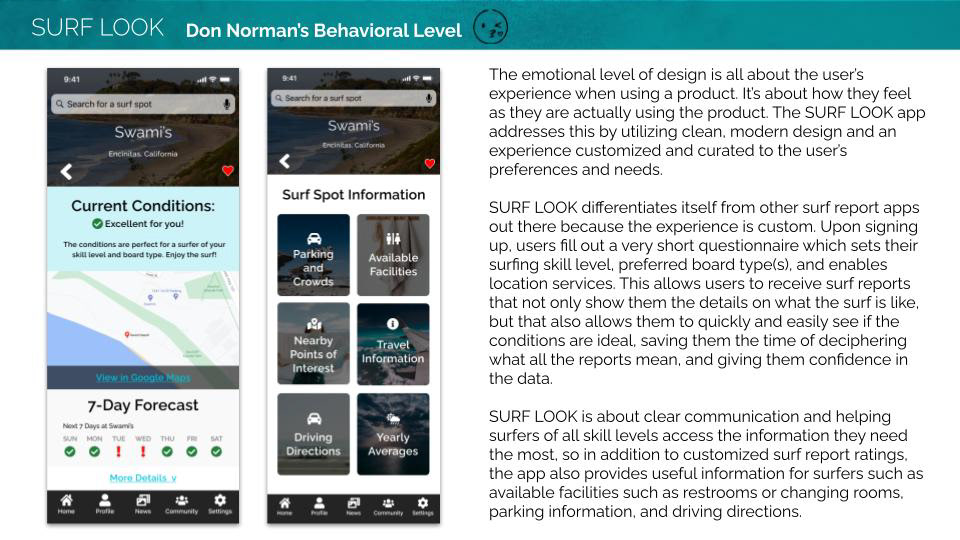
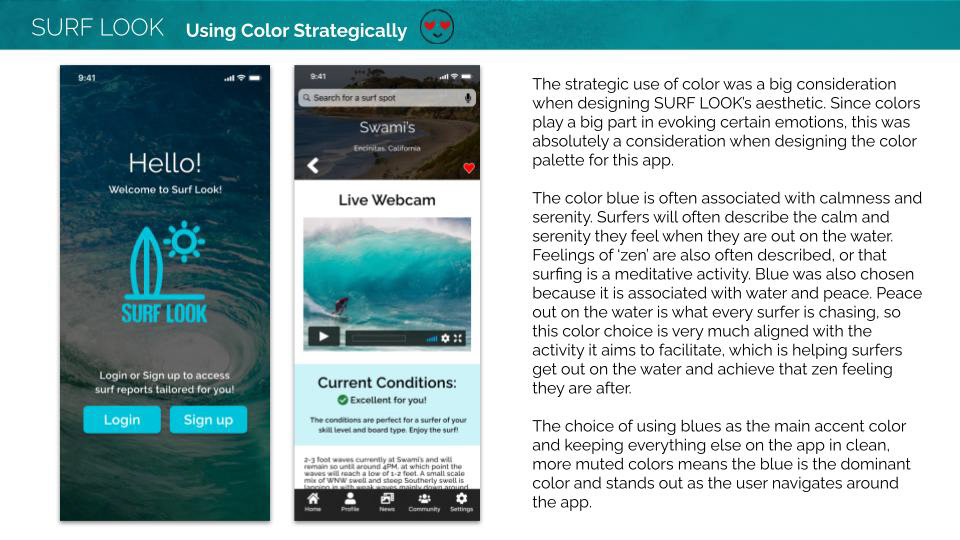
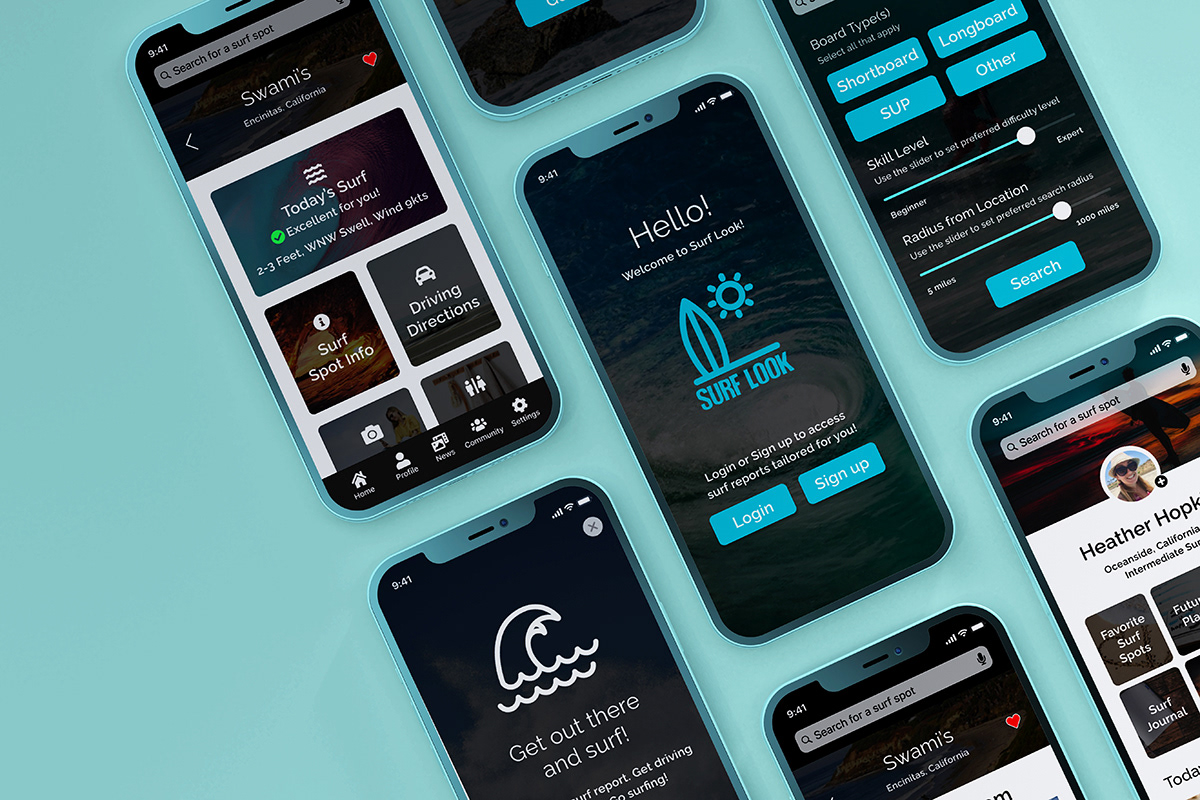
Visual Designs for Mobile app
high fidelity clickable prototype
Reflections
Over the course of this project, I spent a lot of time talking with surfers and what they might want out of a surf report app, which led me to think of the kinds of things I might want to include in the initial setup of the app as well as future further developments to the kinds of features an app of this nature might include. I now have a much better understanding of what might draw users to SURF LOOK.
At this point in the project, it is still too early to tell what the usage statistics on the app might be, but I am armed with the knowledge and experience in what kinds of useful features people would want to see in SURF LOOK, which will inform future decision-making processes when moving forward with the building out of additional features.
At this point in the project, it is still too early to tell what the usage statistics on the app might be, but I am armed with the knowledge and experience in what kinds of useful features people would want to see in SURF LOOK, which will inform future decision-making processes when moving forward with the building out of additional features.
To view some of my final reflections on this project as well as images of the evolution of the app and some ideas for future iterations, you can check out the full report in this PDF.
Future Steps
The next steps will be to get the initial phase of the app coded and then conduct extensive usability tests of the app at this stage using a variety of users from different backgrounds, and then to break down the findings of those usability tests in a rainbow spreadsheet, rated with Jakob Nielsen’s scale, to help determine actionable items of improvement on the app and to rank them according to importance level.
After that, edits to the app will be made in accordance with the findings of the test sessions.
If you've got time on your hands and you're interested in a really deep dive into the entire process I went through when creating SURF LOOK, you can check out this link to access a 324-page PDF detailing every single step of my process.